ETH’s spike in address activity didn’t coincide with ‘profit-taking opportunity’

- ETH sold at a five-week high of $1,335 on 13 November.
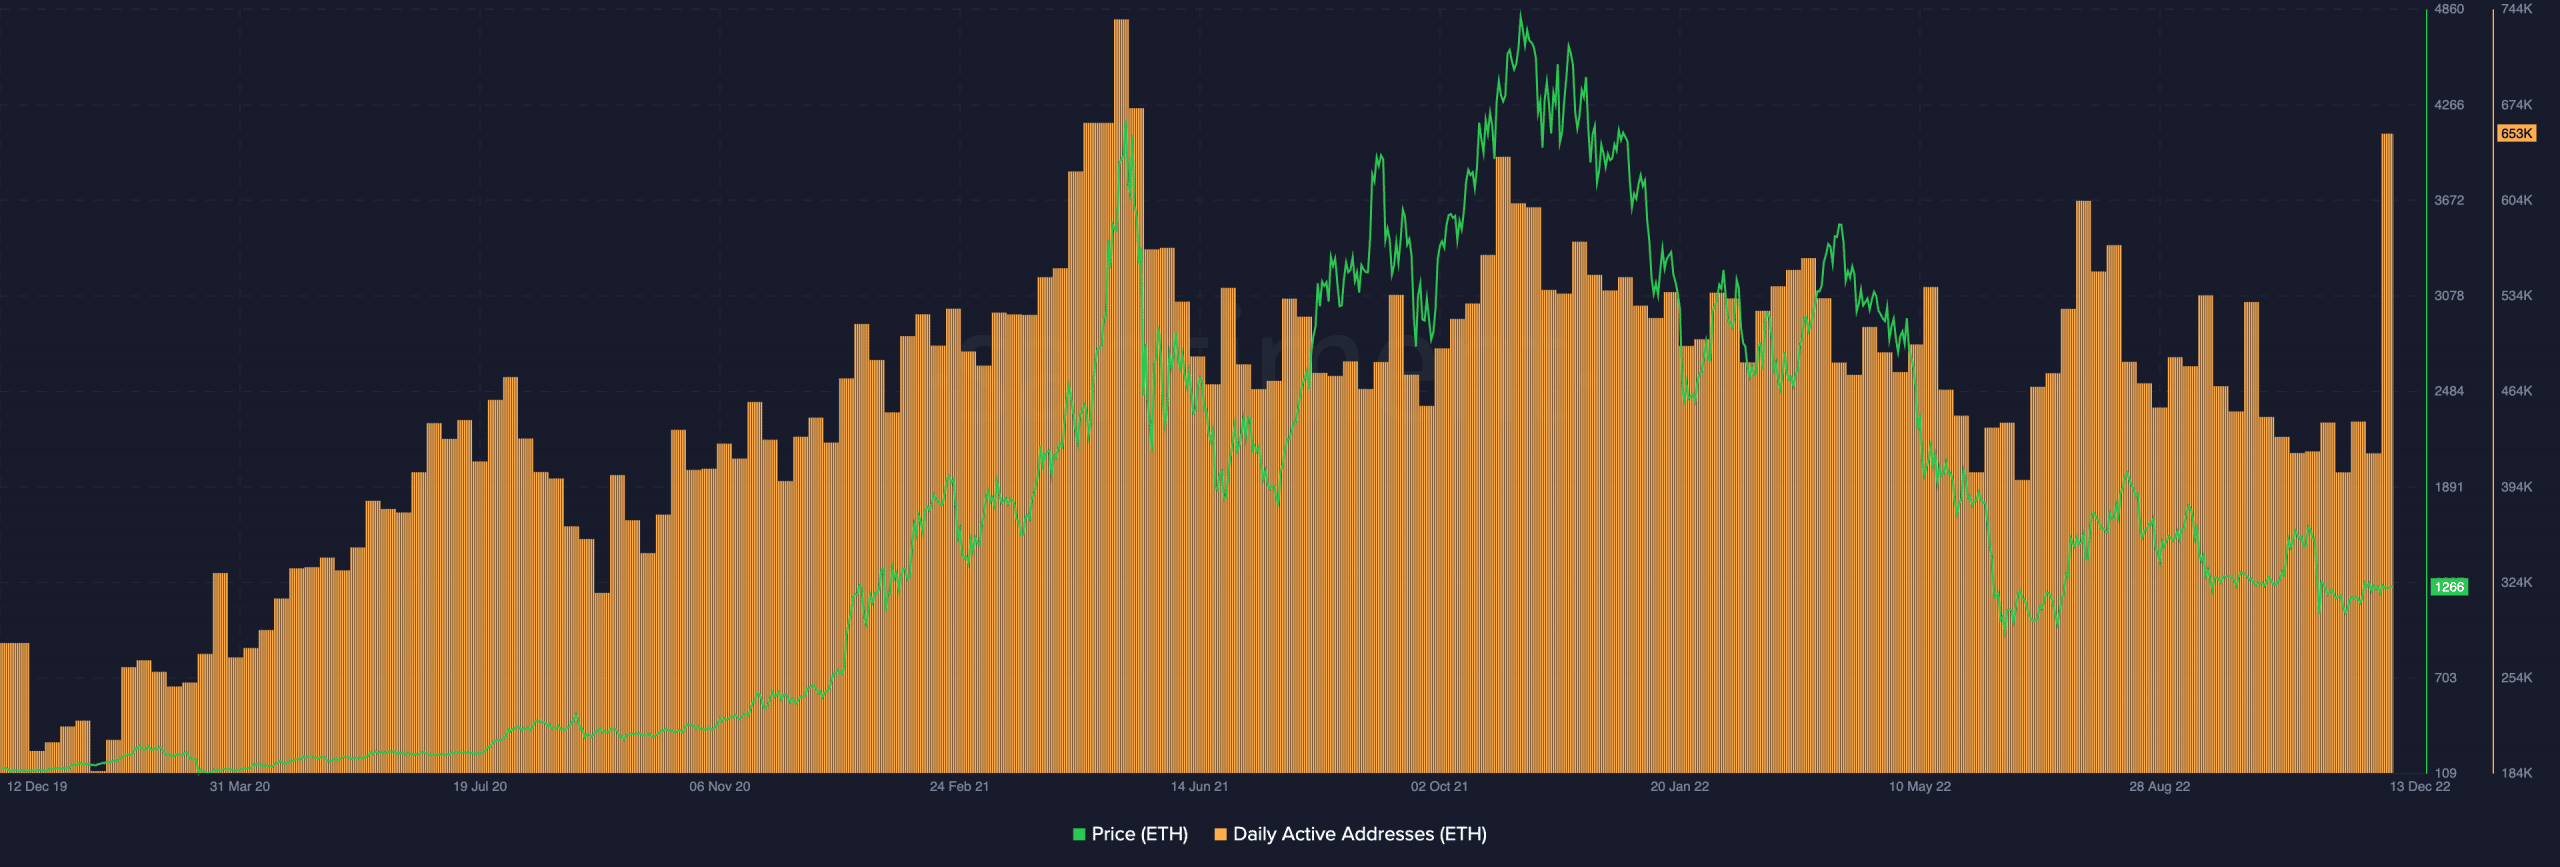
- Daily active addresses rallied to a year-high of 653,000.
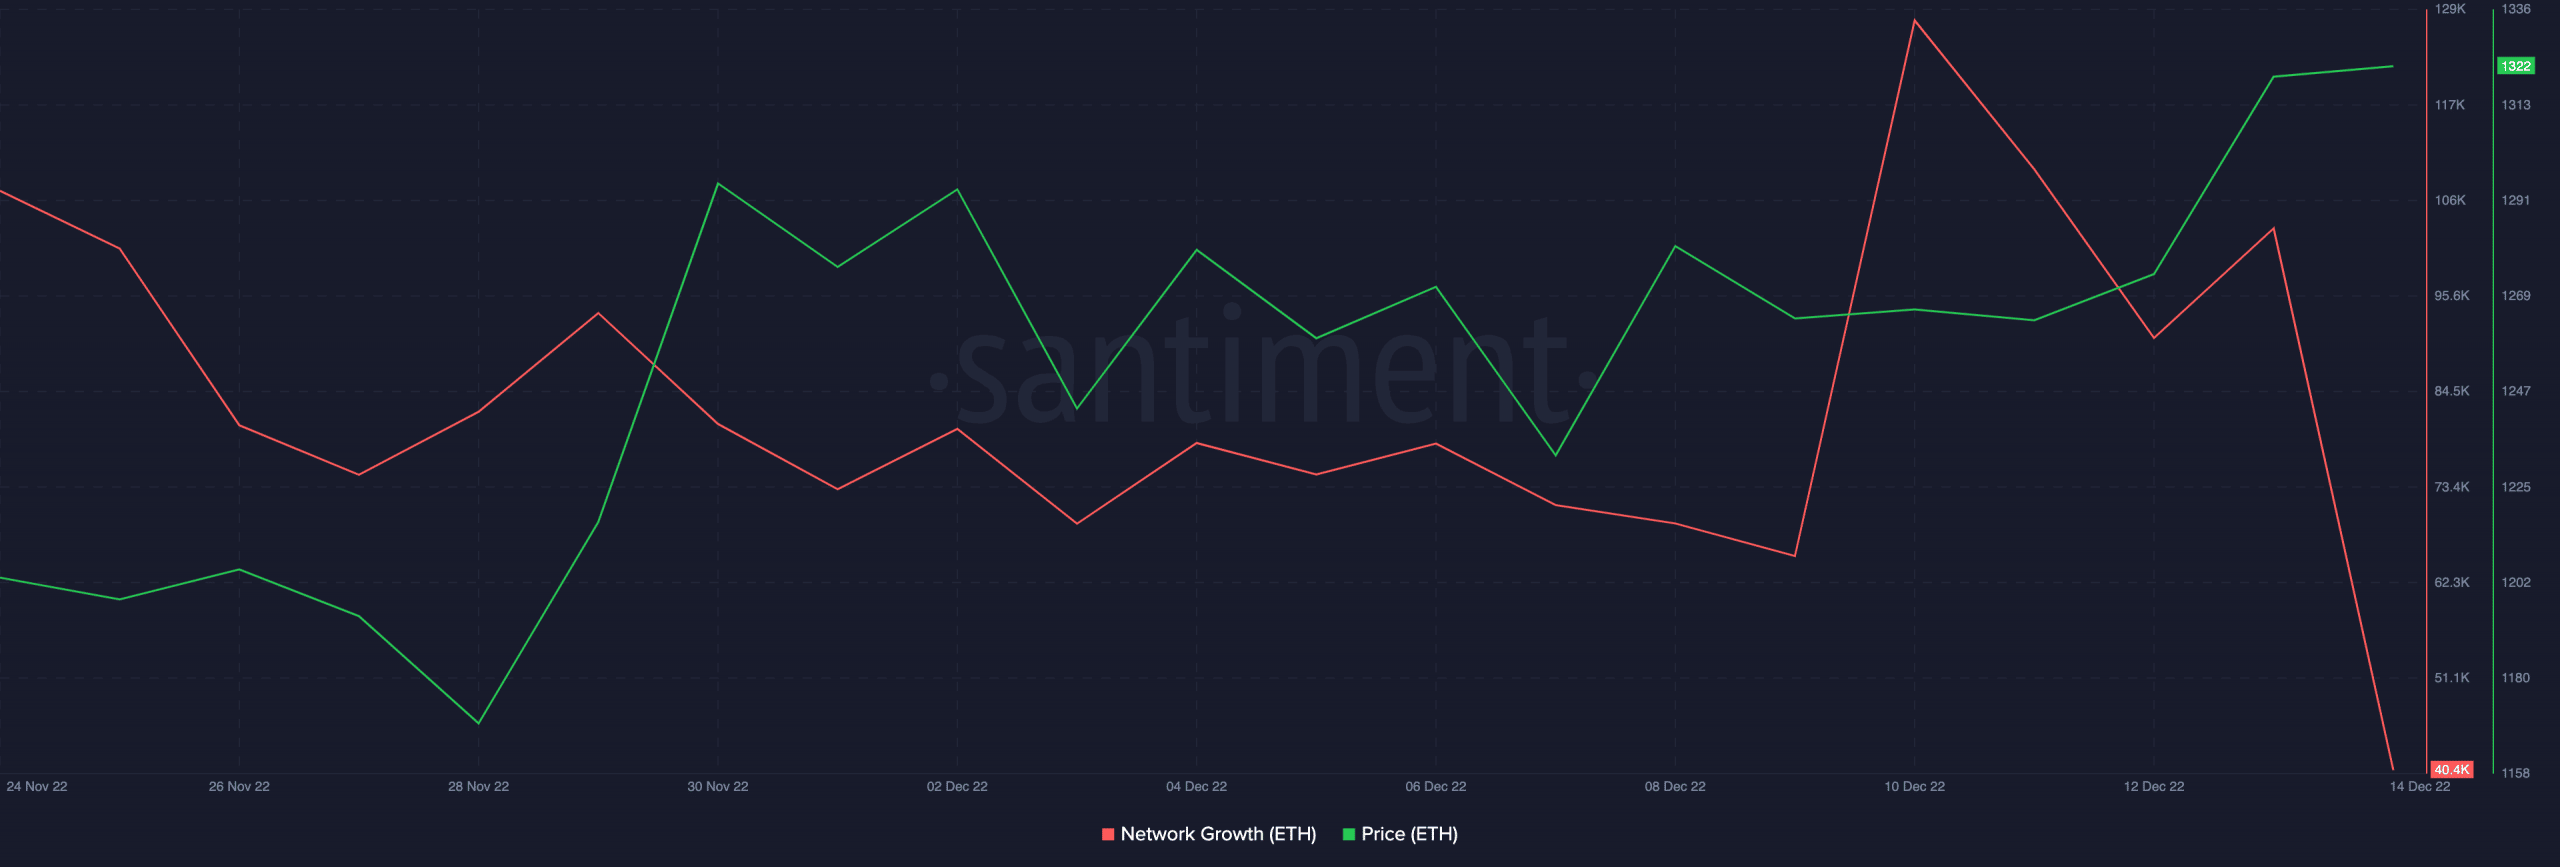
- There was a decline in ETH’s network growth.
Having traded momentarily at the $1,335 price mark, the leading altcoin Ethereum [ETH] hit a five-week high during the intraday trading session on 13 November.
Read Ethereum’s [ETH] Price Prediction 2023-2024
Per data from Santiment, the price jump was due to the rally in the count of unique addresses that traded the alt. At 653,000 daily active addresses trading ETH at press time, this represented the largest daily high since May 2021.
With the current state of the general market and the fixation of many investors on seeing gains in their investments, a jump in an asset’s price is usually followed by a surge in profit-taking.
But, interestingly, the growth in ETH’s price and daily active addresses did not coincide with “a normal profit take opportunity,” Santiment noted.
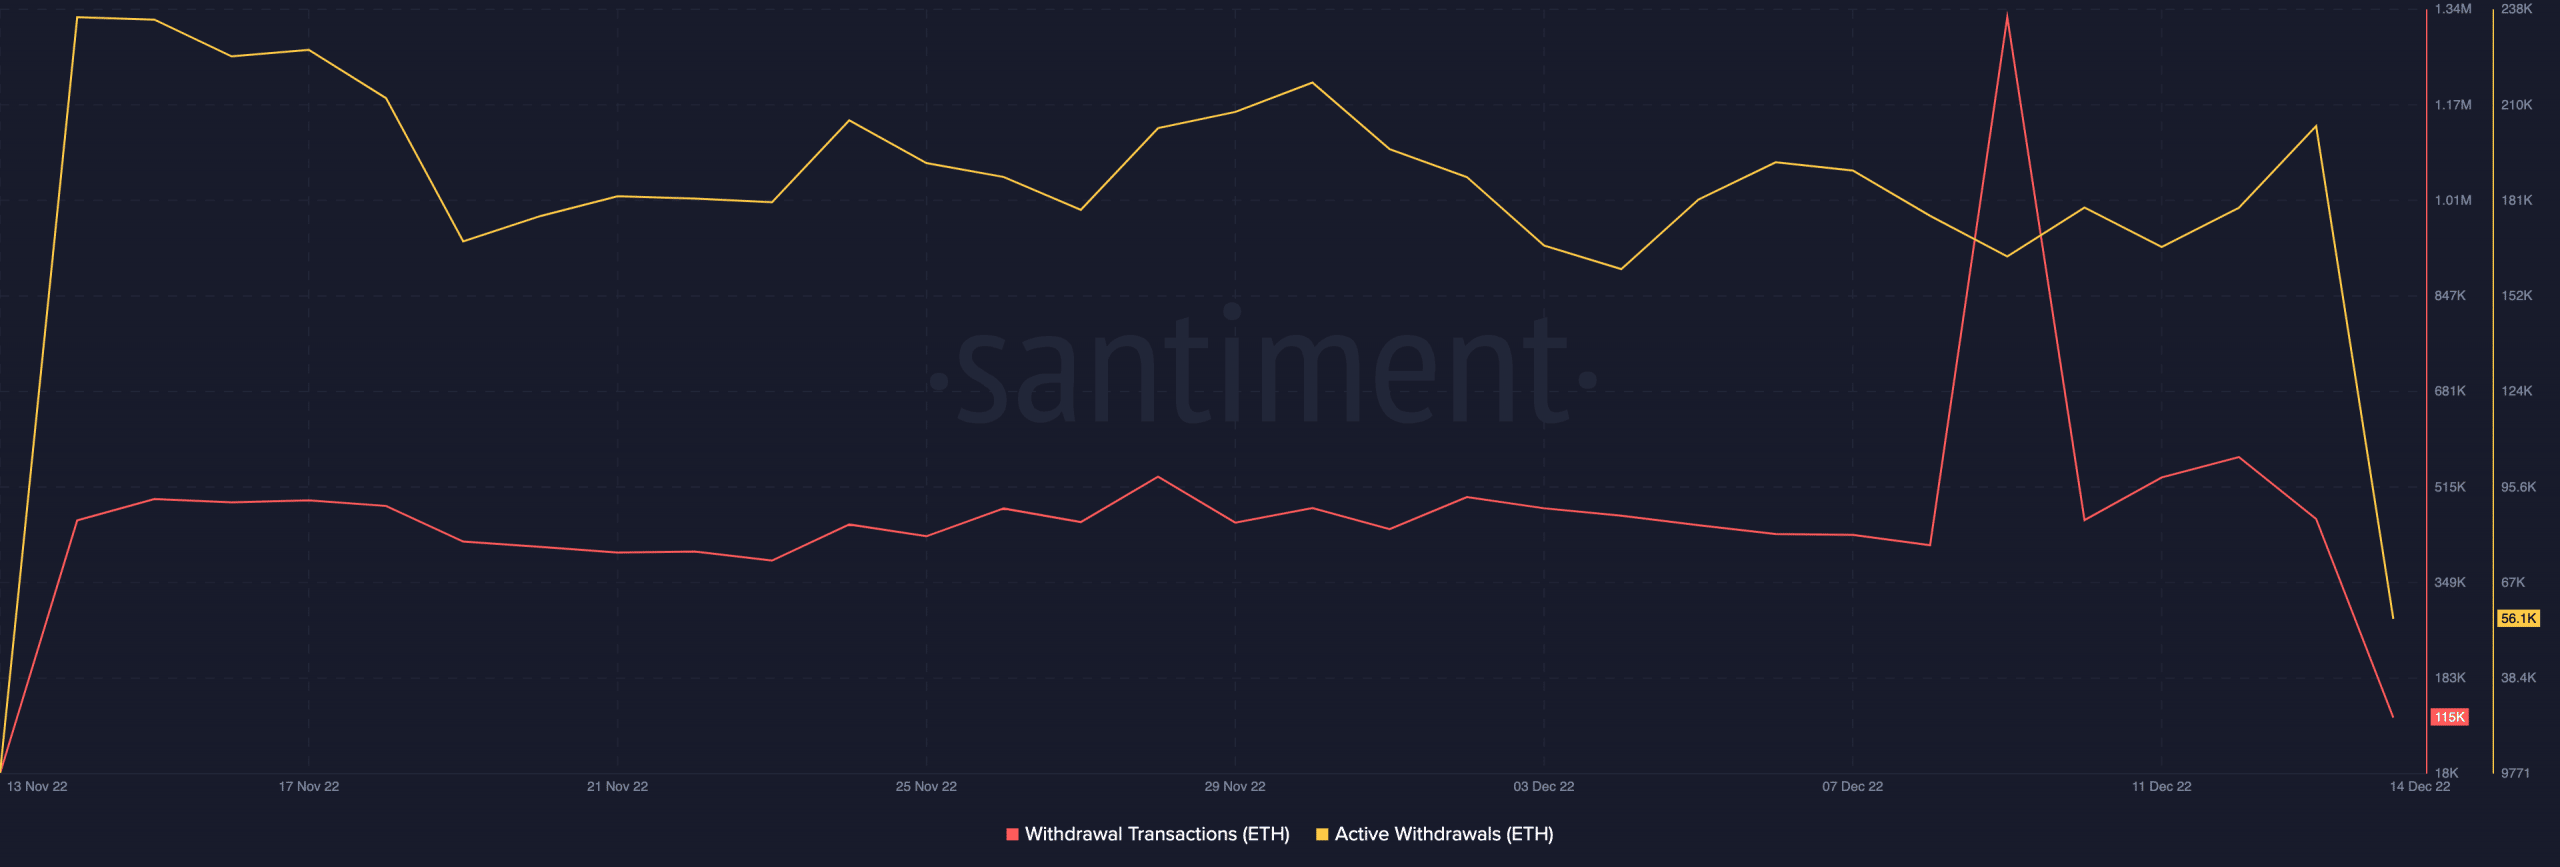
In fact, in the last 24 hours, active ETH withdrawals fell by 72%. In addition, the ETH withdrawal transactions count also dropped by 75% within the same period. This was an indication that the price rally did not lead to any inordinate rally in profit-taking by ETH holders.
A look at ETH’s exchange activity in the last 24 hours further corroborated this position. While its exchange inflows declined by 80%, ETH’s exchange outflows rallied by 73% in the last 24 hours. This showed that ETH accumulation exceeded its sell-offs.

Buyers are forging ahead
While ETH’s price rebounded from the five-week high, it traded at $1,322.10 at press time. Its time was up by 5% in the last 24 hours. With ETH’s transaction worth $8 billion completed within the same period, trading volume was up by 80%.
Assessed on a daily chart, ETH continued to see increased accumulation putting the buyers in control of the market. The position of ETH’s Directional Movement Index (DMI) confirmed this. At press time, the buyers’ strength (green) at 21.32 rested above the sellers’ (red) at 18.40.
Further, key indicators such as the Relative Strength Index (RSI) and Money Flow Index (MFI) revealed the intensity of ETH accumulation at press time. For example, the RSI was spotted in an uptrend at 57.08, while the MFI was at 63.74
Both indicators positioned above their respective neutral regions showed that ETH accumulation volume exceeded the distribution rate.

While the number of unique daily addresses that traded ETH was pegged at its highest level since May 2021, on-chain data revealed a reduction in new demands on the network. According to on-chain data from Santiment, ETH’s network growth declined by 61% in the last 24 hours.
It is trite to note that once buyers’ exhaustion sets into the market, and new demand for ETH fails to come in, a price decline might follow.