Evaluating if Tron [TRX] is up for a trend reversal this week

The continued decline in the price of Tron [TRX] has led to an increase in the negative bias against the crypto asset, new data from Santiment revealed.
Data from CoinMarketCap showed that on a year-to-date basis, the price of TRX has gone down by 17.28%. As the decline persists, TRX investors linger in their pessimism toward any significant price rally in the short term.
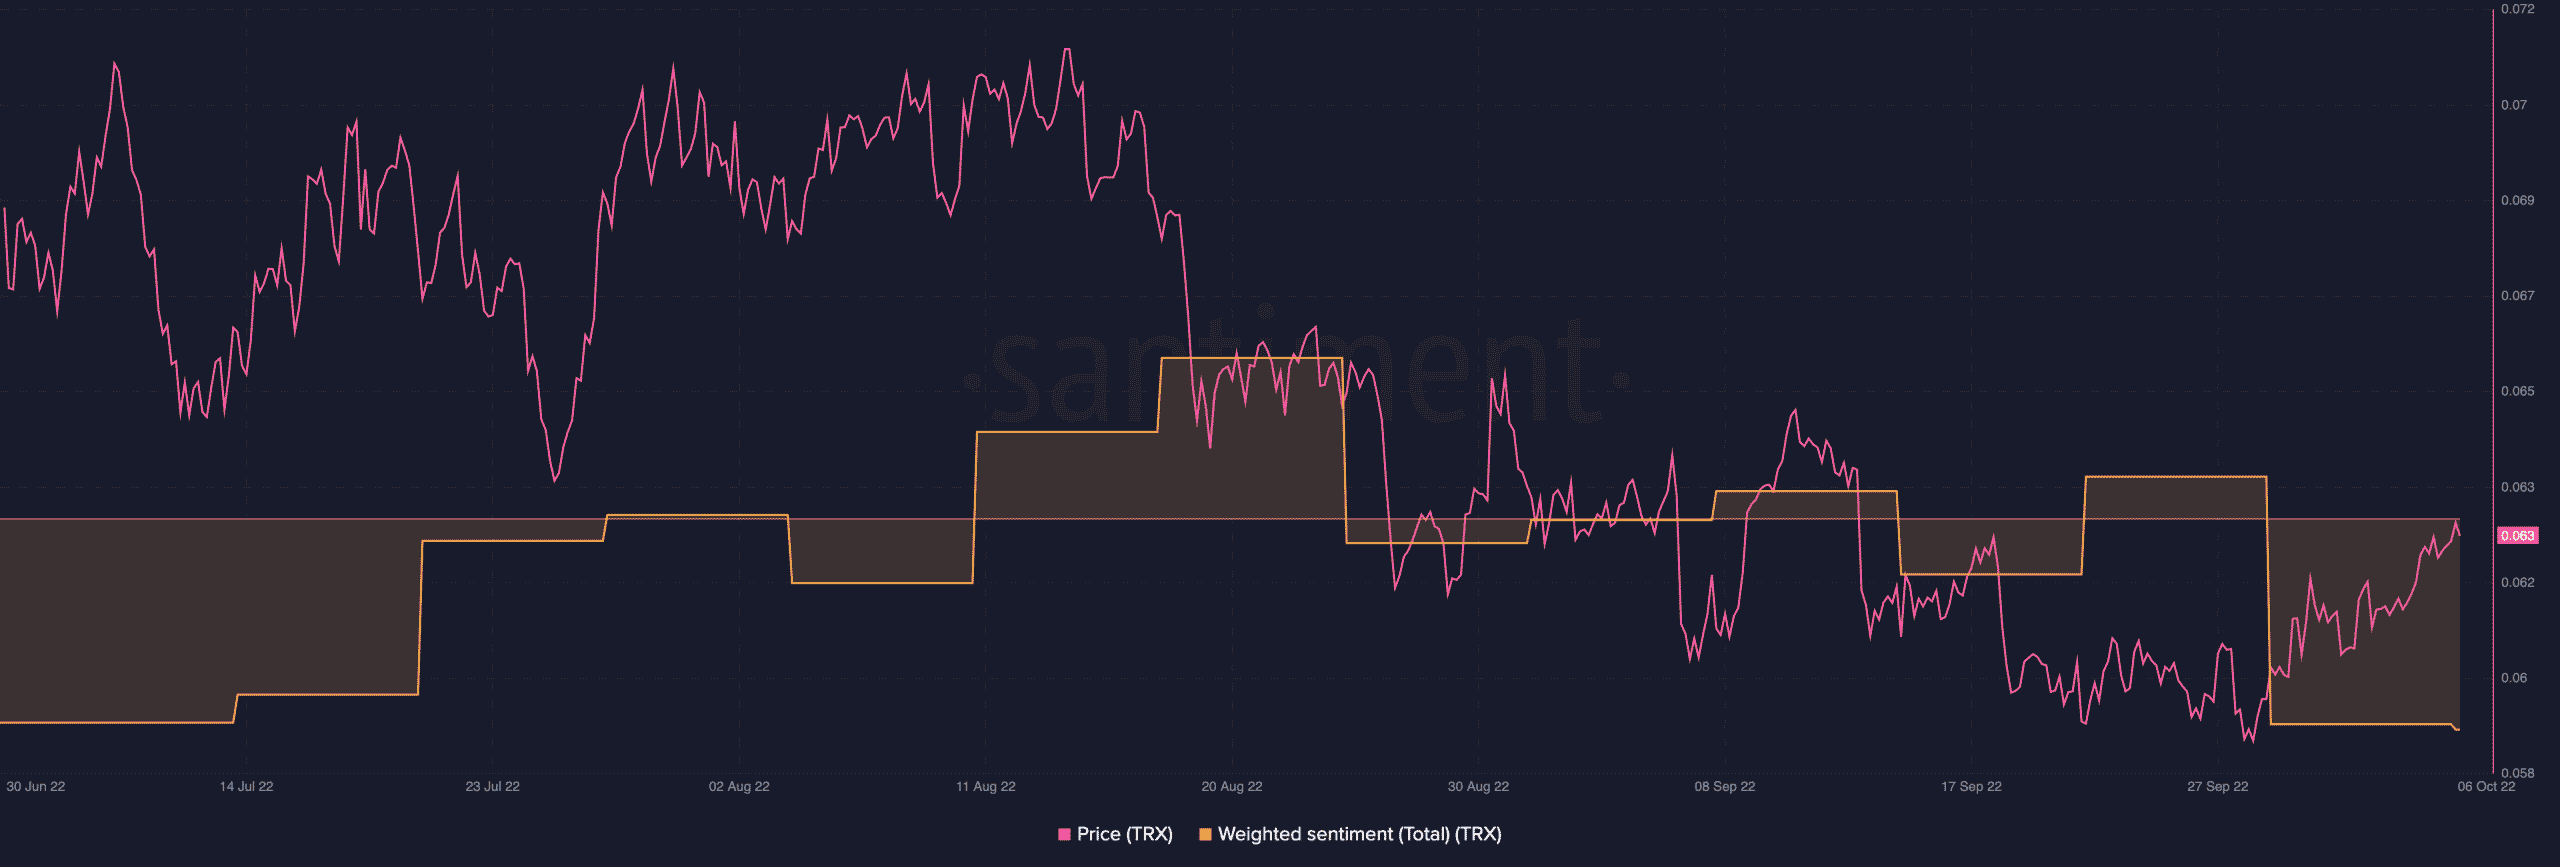
According to Santiment, historically, the growth in negative bias toward a crypto asset is an indication that the bottom for such an asset is near. The continued capitulation, according to the blockchain analytics firm, “may soon lead to price rebounds.”
TRX bulls are looking to score a screamer
As of this writing, TRX exchanged hands at $0.06286. On a daily chart, the price of the asset had rallied in an uptrend since 29 September. So far this month, the price per TRX has gone up by 2%, data from CoinMarketCap revealed.
The growth in the price of the asset corresponded with the intersection of the MACD line with the trend line in an upward direction. This indicated the commencement of a new bull cycle at the end of September.
Further, as the price of TRX continued to grow, the dynamic line (green) of the coin’s Chaikin Money Flow (CMF) rose from below the center line (red) to be positioned above it at 0.07 by press time.
Only a significant surge in buying pressure can influence such a movement in an asset’s CMF in less than a week.
In addition, the Relative Strength Index (RSI) marked its spot at 57.40 at press time in an uptrend. As buyers flocked to the TRX in the past few days, the indicator journeyed from below the 50-neutral region to be positioned above it.
Toeing a similar path, the Money Flow Index (MFI) was pegged at 61.88 at press time.
TRX buyers had control of the market at press time, as shown by the position of the Directional Movement Index (DMI). The buyers’ strength (green) at 20.48 was solidly above the sellers’ (red) at 14.95.
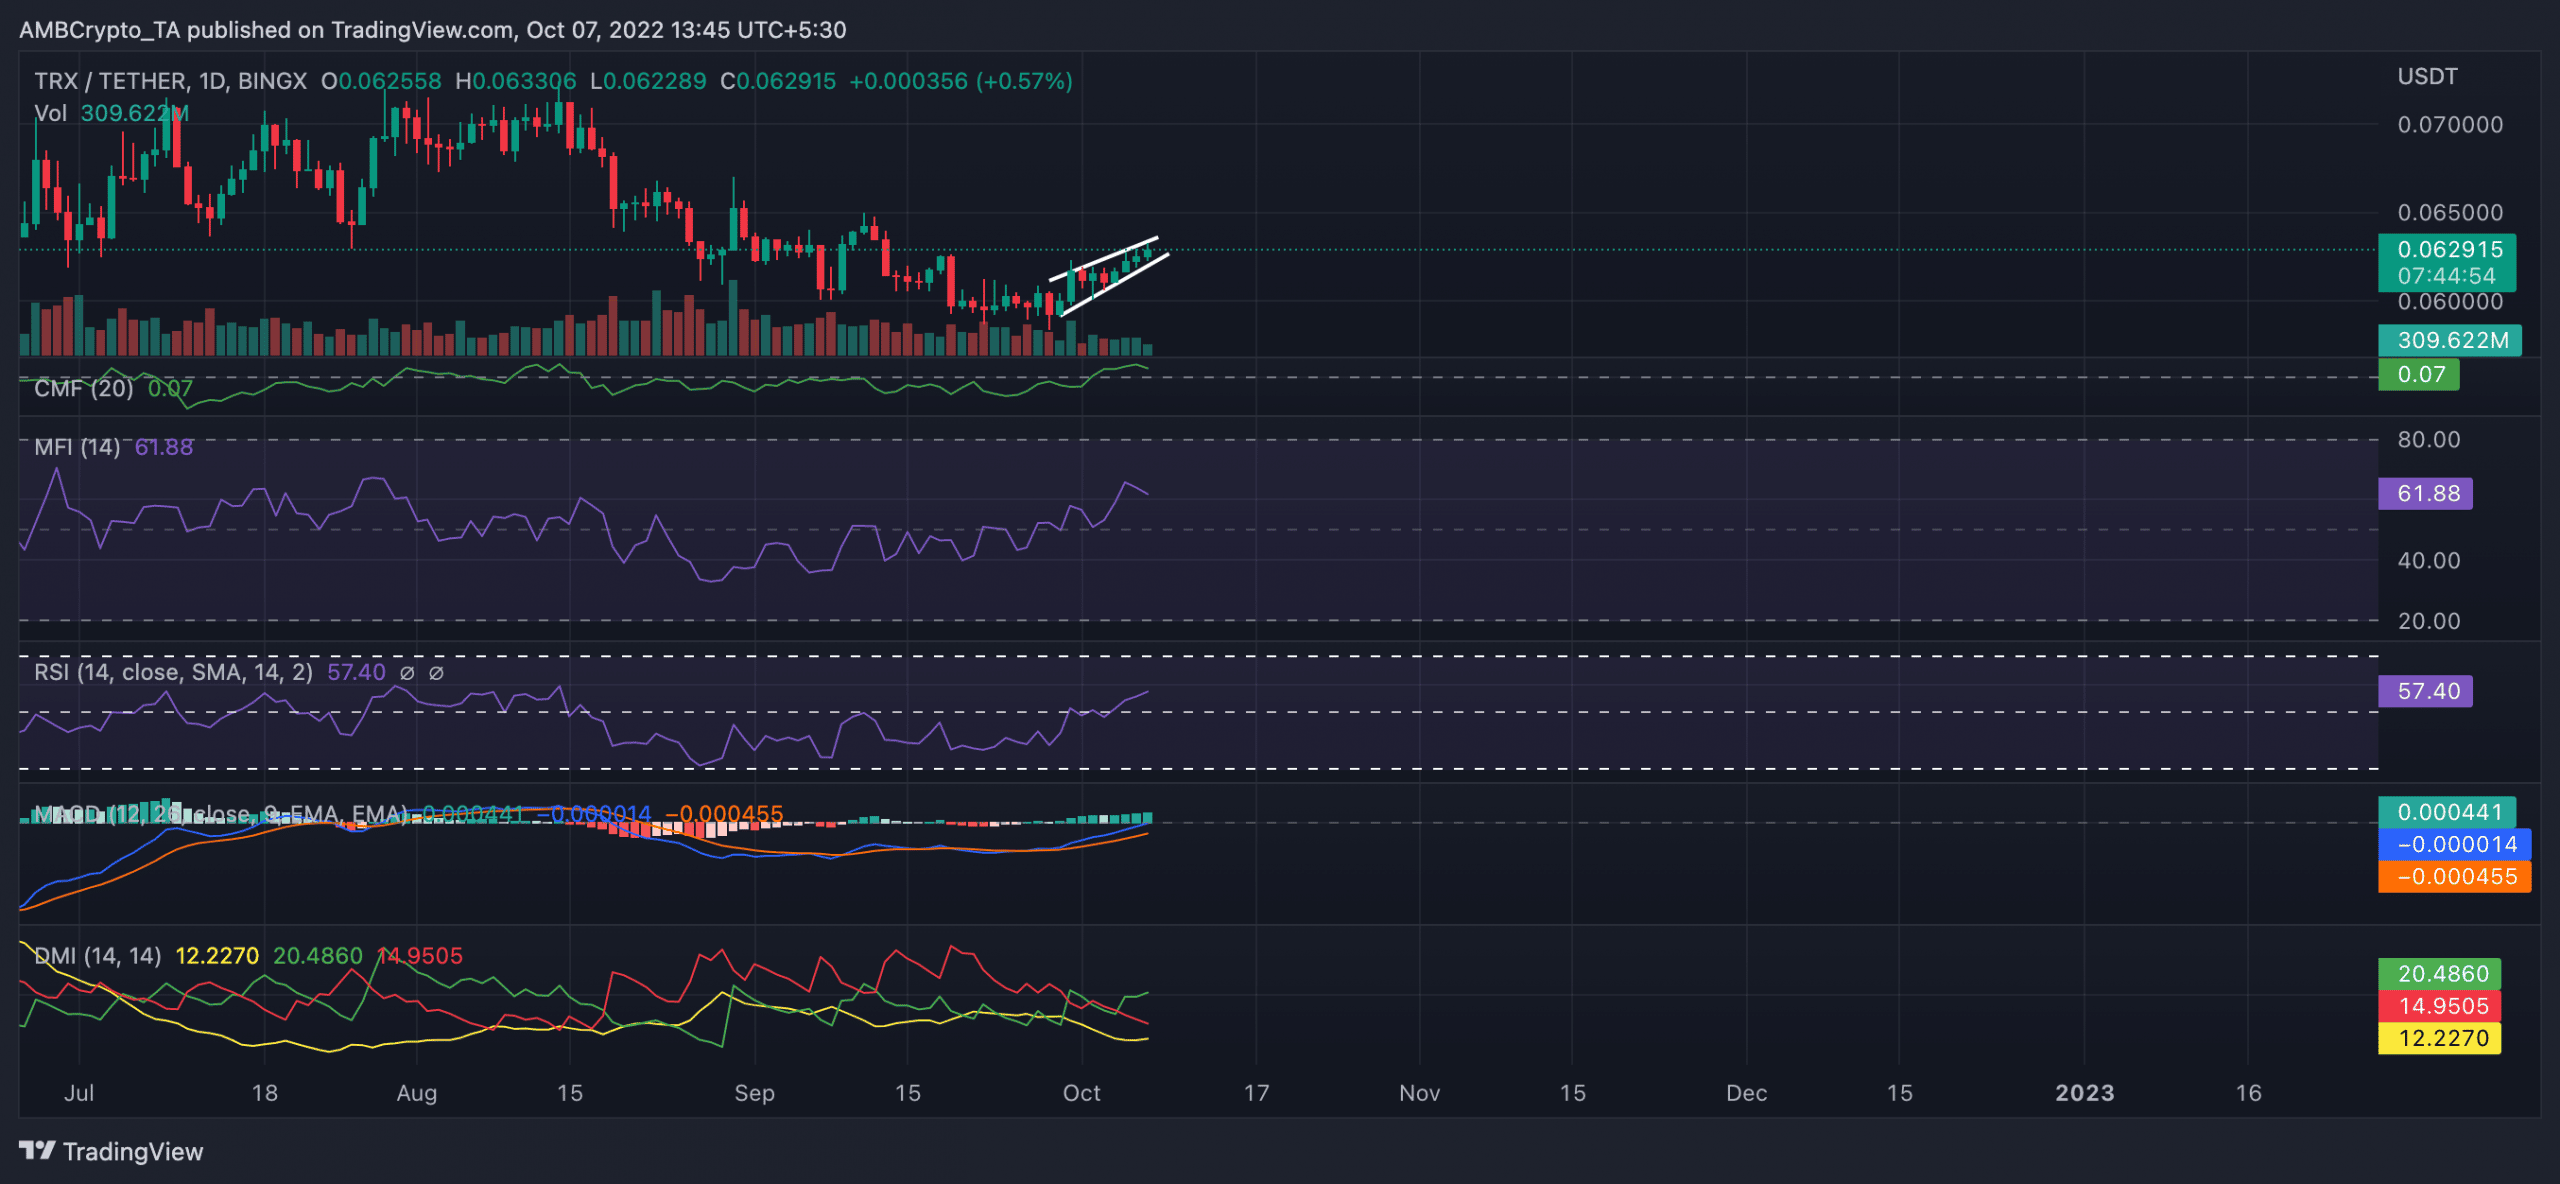
On a daily chart, the price rally in the past few days has led to the formation of a rising wedge. This is usually followed by a decline in price.
Therefore, investors looking to trade with and against the market should be on the lookout for a reversal.


