Fantom [FTM] surges to $0.46, but here’s why the rally could halt

Disclaimer: The information presented does not constitute financial, investment, trading, or other types of advice and is solely the writer’s opinion.
- The trendline resistance could halt or even reverse recent gains.
- The $0.4 area has served as significant support throughout March.
Fantom [FTM] rallied strongly from a zone of support the bulls established around the $0.4 mark. In the past 36 hours, the price rallied by almost 18% from the swing low at $0.4096 to the swing high at $0.467.
Read Fantom’s [FTM] Price Prediction 2023-24
In other news, Fantom announced its intent to modify the requirements for validator staking on 25 March. The new proposal had significant modifications that would have noticeable consequences in the processes and requirements for validators.
The resistance from the volume profile could halt the bullish advance
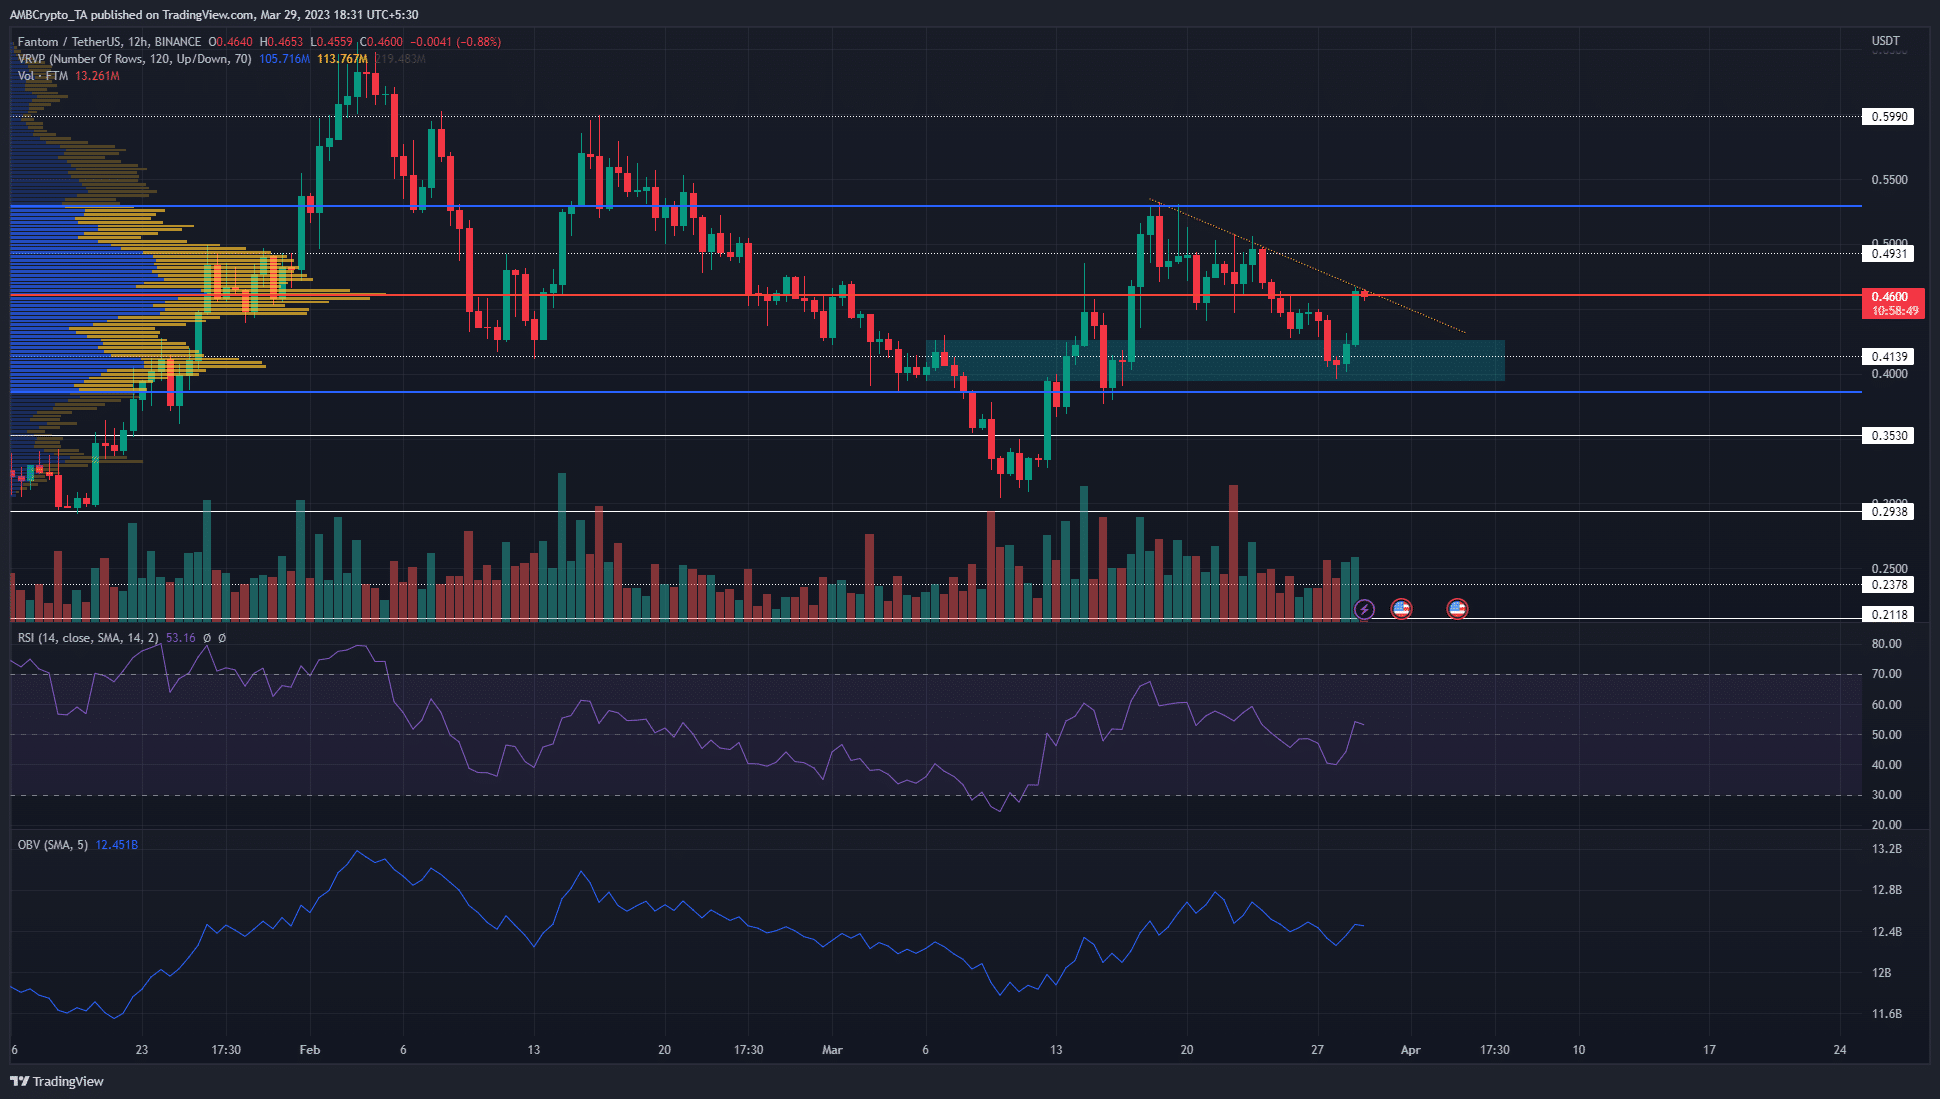
In orange, a trendline resistance was plotted. This captured the short-term downtrend that FTM had been on. On the higher timeframe charts, this was a pullback after the rally from $0.31 to $0.52 earlier this month.
Alongside the trendline resistance, the Visible Range Volume Profile showed that the Point of Control (red) also sat at $0.46. This was a confluence of resistances that could see the rally shift into a consolidation phase over the next few days.
FTM traders can expect some lower timeframe ranging price action in the coming hours. Thereafter, whether a breakout upward or rejection at $0.46 followed remained to be seen. The OBV has been rising in March and indicated steady demand.
The RSI was on the verge of closing a session above neutral 50, which would be a sign that momentum had shifted in bullish favor.
Is your portfolio green? Check the Fantom Profit Calculator
Signs of network-wide accumulation hinted at a bullish breakout
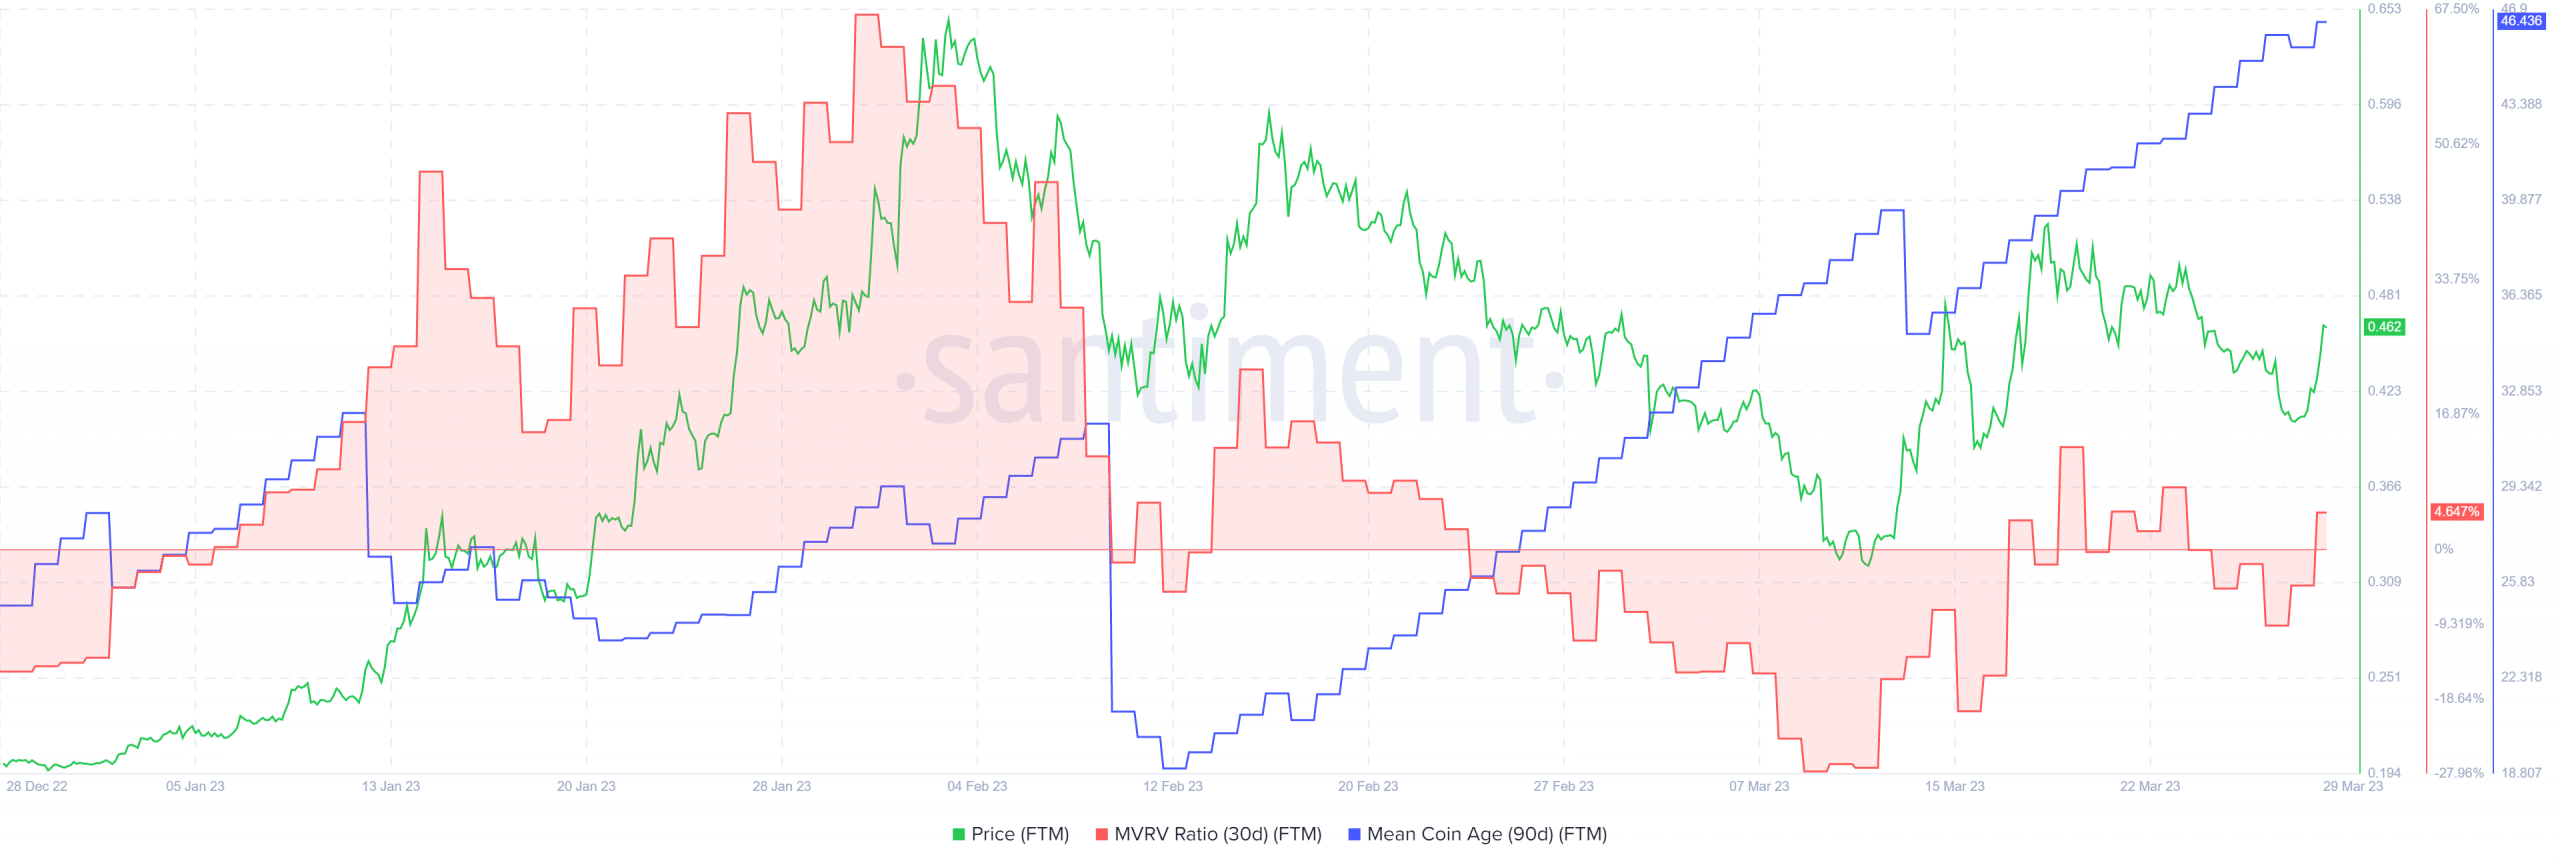
Although rejection at resistance was possible, the on-chain metrics showed a continued move upward was more likely. The 90-day mean coin age has been on an uptrend since mid-February. It saw a sharp dip on 13 March, when FTM tested the $0.4 area as resistance. The move back above $0.4 emboldened the bulls.
The 30-day MVRV ratio was close to zero and indicated that there was room for the trend to go higher. Profit-taking and the added selling pressure were not yet a concern for traders, according to this metric.


