Fantom: How an EMA crossover could influence FTM’s path

Over the last few days, retail investors have resurged their interest in the market while the overall sentiment registers an uptick. Thus, the slightly elevated buying pressure helped FTM reclaim critical support levels in the last ten days.
The recent upswing chalked out a rising wedge in the four-hour timeframe. Any close below the pattern would expose the alt to a near-term downside. At press time, FTM traded at $0.3365, up by 7.74% in the last 24 hours.
FTM 4-hour Chart
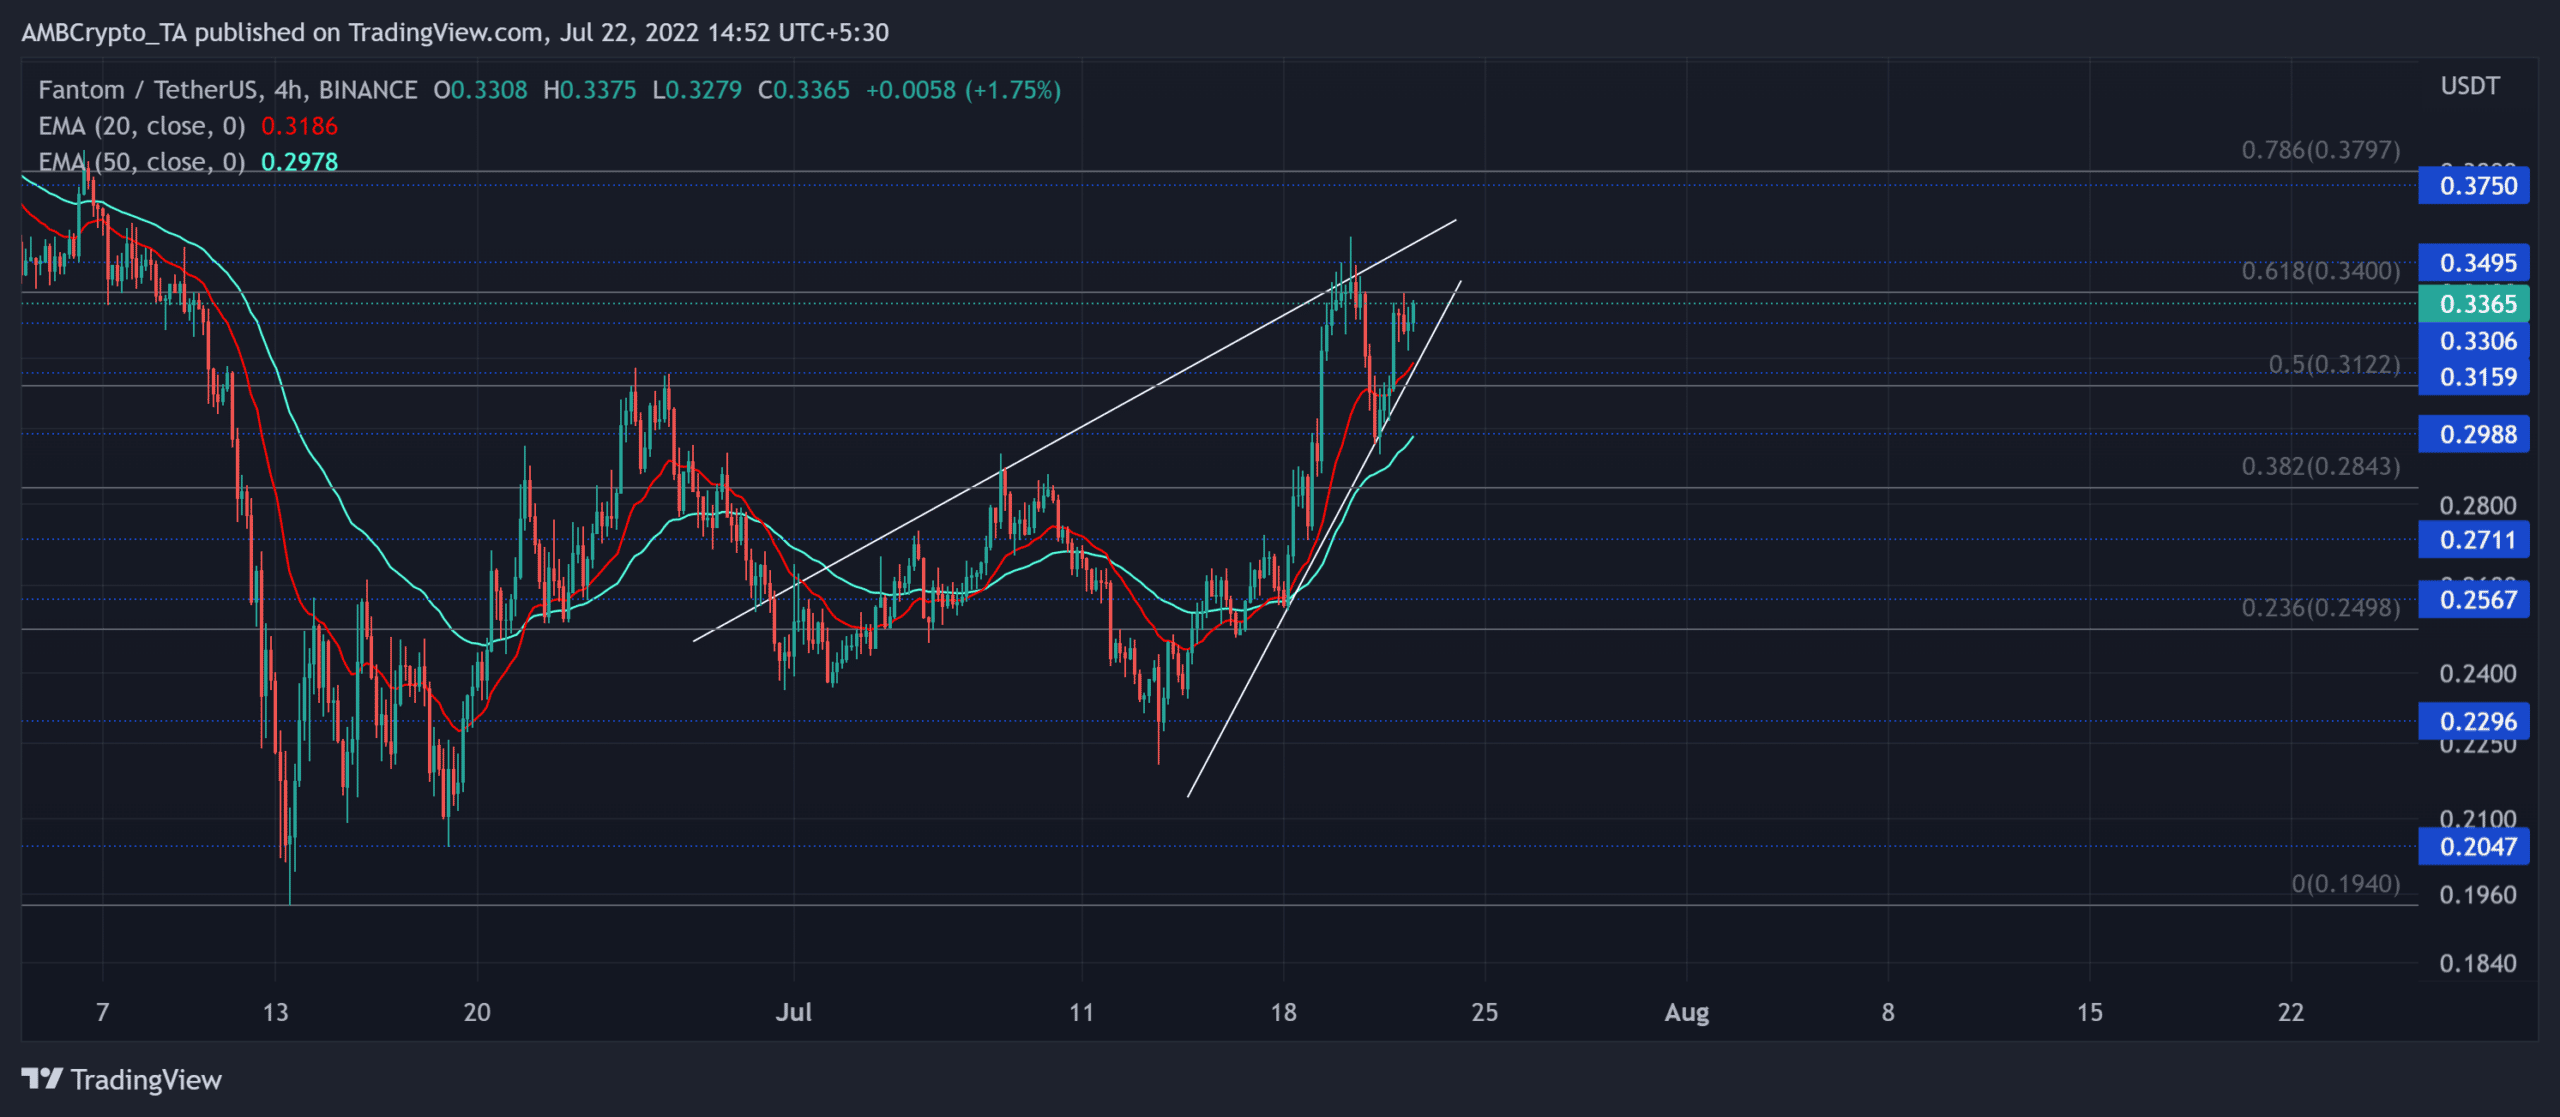
A string of higher highs and troughs pushed FTM above the 38.2% and the 50% Fibonacci levels. This progression entailed a rising wedge (reversal) structure on the chart.
After bagging in a nearly 50% ROI in the last eight days, FTM tested the 61.8% level near the $0.34 region. With a gradual decline in trading volumes in the last three days, the buyers failed to display a robust effort to snap the golden Fibonacci mark.
The recent rally provoked a bullish crossover of the 20 EMA (red) and 50 EMA (cyan) with the 200 EMA (green). This crossover has opened doorways for a long-term bullish perspective.
Any potential rejection of higher prices from the 61.8% level can propel a near-term setback before a revival. A close below the wedge could pave a path to the $0.31 zone before the buyers recoup their forces.
The bulls would likely aim for a gradual uptrend in the coming times. Should the sellers dwindle, immediate recovery from the 61.8% level could see a hurdle in the $0.37-zone.
Rationale

The RSI has managed to maintain a position above the midline while exhibiting a bullish inclination. It revealed a sign that the buying market was strengthening. Any reversals from the overbought mark could slow down the current rally.
Also, the CMF’s recent lower peaks bearishly diverged with the price. So, a likely reversal from its trendline resistance should not surprise the investors/traders.
Conclusion
Given the rising wedge setup approaching the 61.8% Fibonacci level, FTM could see a short-term setback. But with the recent golden cross in the four-hour timeframe, bulls would aim to hold their grounds and propel a relatively quick recovery in the coming sessions.
The targets would remain the same as discussed.
Finally, FTM shares a 91% 30-day correlation with the king coin. A close eye on Bitcoin’s movement would be imperative to make a profitable move.


