Fantom is back above $2.75; will previous highs be next to fall

Disclaimer: The findings of the following analysis are the sole opinions of the writer and should not be considered investment advice
Fantom was strongly bullish on the hourly chart as it rose above the key level at $2.75 and flipped the area from supply to demand. The $3.15 zone marked a local top and Fantom bulls had their eyes set on $3.15 and $3.44 as possible take-profit target levels.
A pullback for Bitcoin could see FTM drop. But, as long as Bitcoin can stay above $42.5k, Fantom appeared poised to perform well in the coming days.
FTM- 1 hour chart

Two sets of Fibonacci levels were plotted. One was based on FTM’s move from $1.3 to $2.44 (white) and this move’s 61.8% extension level marked a local top for FTM. The other was based on the retracement from $3.15 to $2.1 (yellow). The $2.75 area had confluence from both sets of Fib levels and also represented an area of liquidity.
Recently, FTM climbed past this area, found some resistance at $2.92, and formed a higher low. This was a strong bullish development on the hourly chart.
The $2.92-$3 area has seen the supply step in for FTM, and the price could spend a few more hours beneath this area before sellers are exhausted. If that scenario unfolds, FTM would likely climb past $3, retest the level as support, and surge to $3.15. Above $3.15, the $3.44 level represented a 27.2% extension level and a take-profit level.
Not only is $3.44 the 27.2% extension, but it is also a level the price wicked to twice in late October. Thereby, meaning sellers are likely to do the same once again if FTM climbs that high.
Rationale
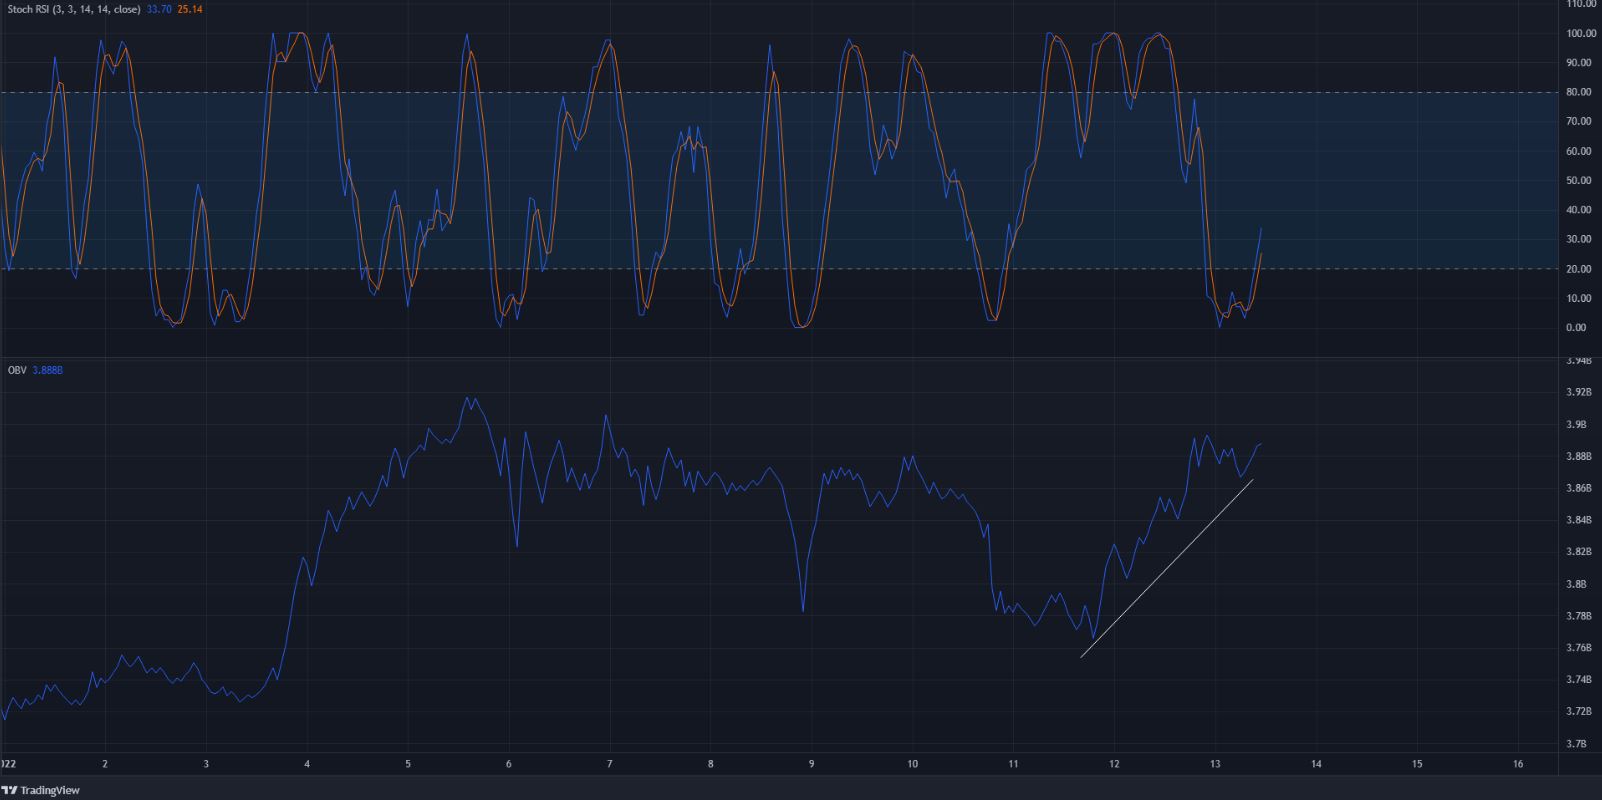
The OBV climbed over the past couple of days as FTM found strong demand in the $2.2 area. This demand could propel FTM higher, now that it is trading above the key level at $2.75.
The Supertrend indicator continued to show a “buy” signal while the Stochastic RSI formed a bullish crossover in the oversold territory. On lower timeframes, this combination generally means strong short-term bullish strength.
Conclusion
The indicators showed that further upside is likely for FTM, while the price charts marked the $3, $3.15, and $3.44-levels as places where the price could face some resistance on the way up. As for support, the $2.75 area, if revisited, would likely give a good risk-to-reward area to buy Fantom at.


