For Avalanche [AVAX], next area of support lies at this Fib retracement level

Disclaimer: The findings of the following analysis are the sole opinions of the writer and should not be considered investment advice.
Avalanche performed well in the market over the past two weeks, although it did shed nearly 40% from 11 June to 19 June. The prices slumped once again after they were unable to push past the $21.5 mark.
Bitcoin also ran into a wave of selling in recent hours. Therefore, bears could have the upper hand on both BTC as well as AVAX charts over the next day or two.
AVAX- 1 Hour Chart
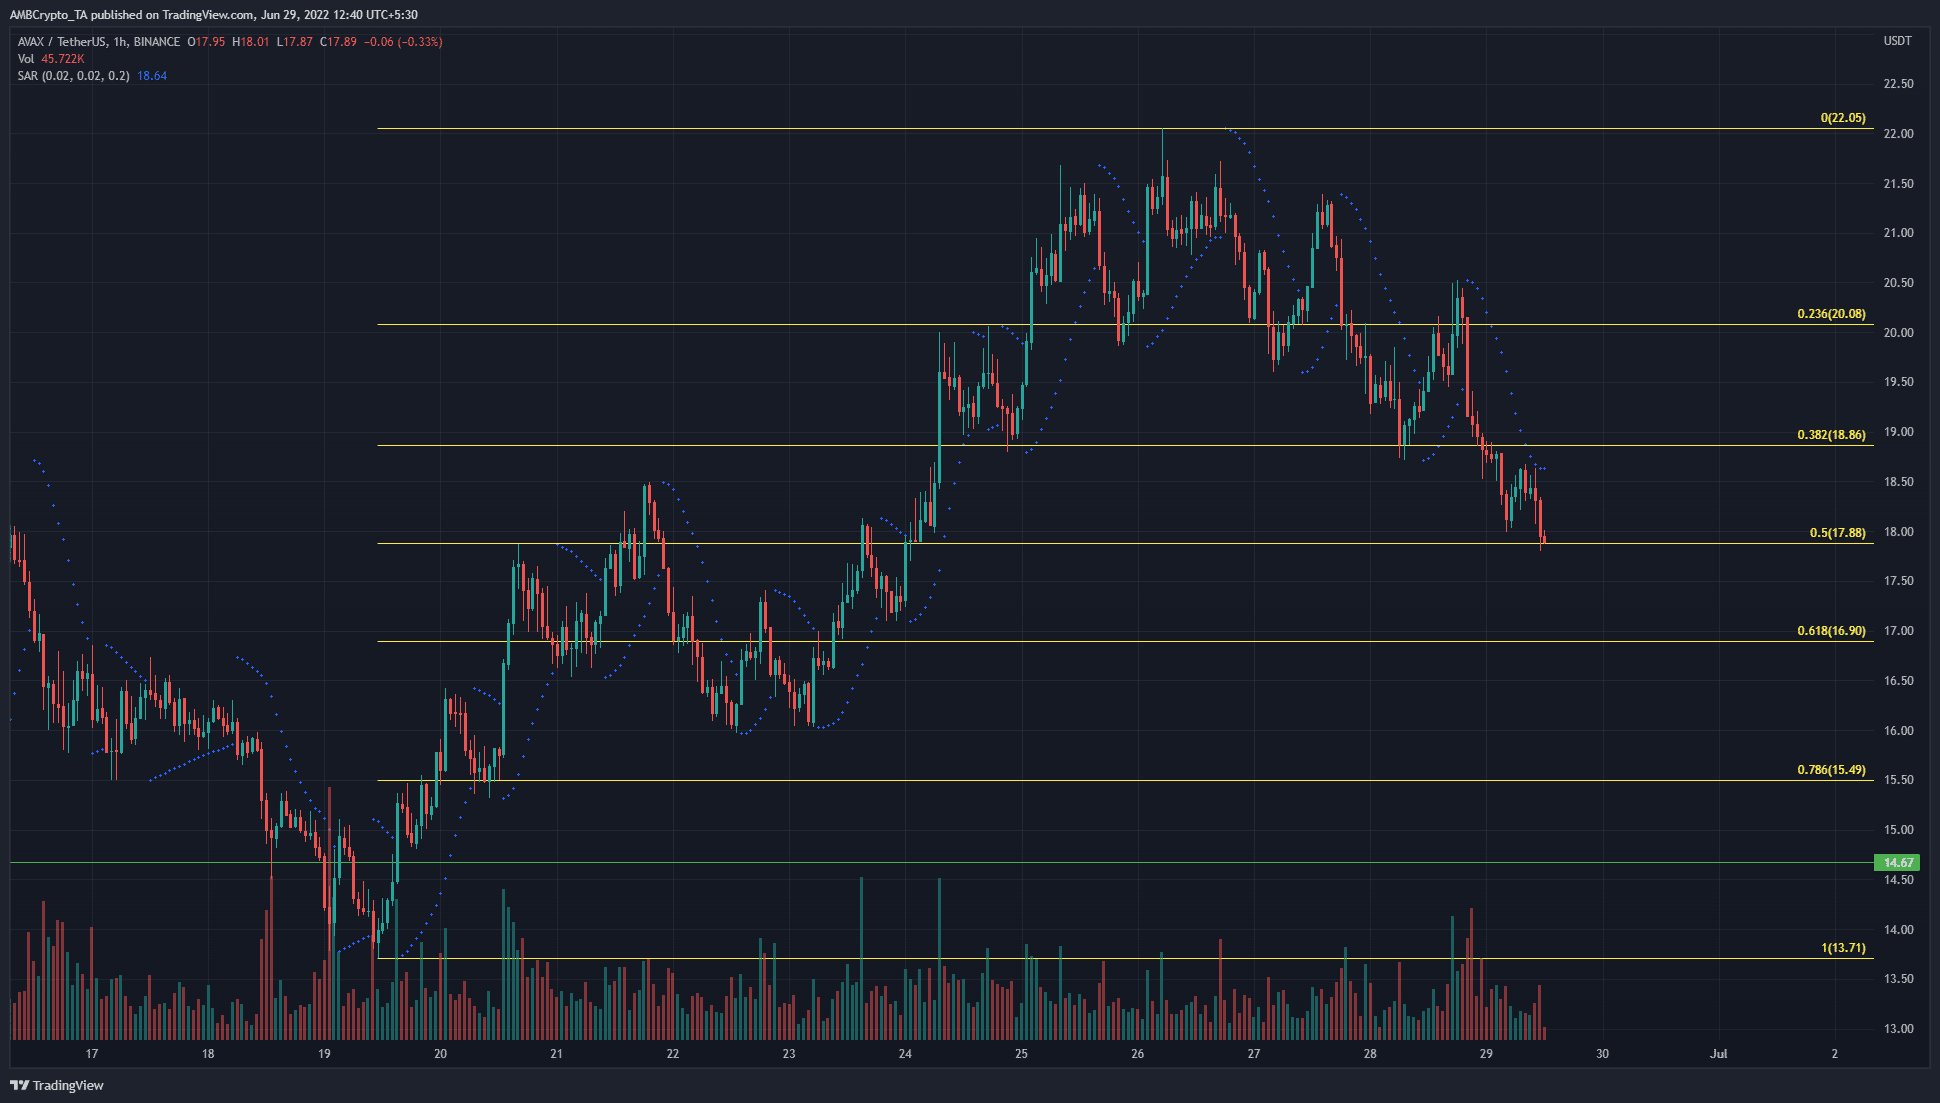
Avalanche saw a surge upward from $13.71 to $22.05 in the past two weeks, and a set of Fibonacci retracement levels were drawn based on this move. The past two days of trading saw the 38.2% retracement level at $18.86 serve as support. A bounce from this level took AVAX to $20.5, but a short-term downtrend appeared to be in play already.
Bitcoin was also unable to defend the $20.2k level, so further lows in the coming hours can not be counted out.
The next area of support for AVAX lies at $16.9, the 61.8% retracement level. The $17.3-$17.2 area could also offer some support to the price on the way down.
Rationale
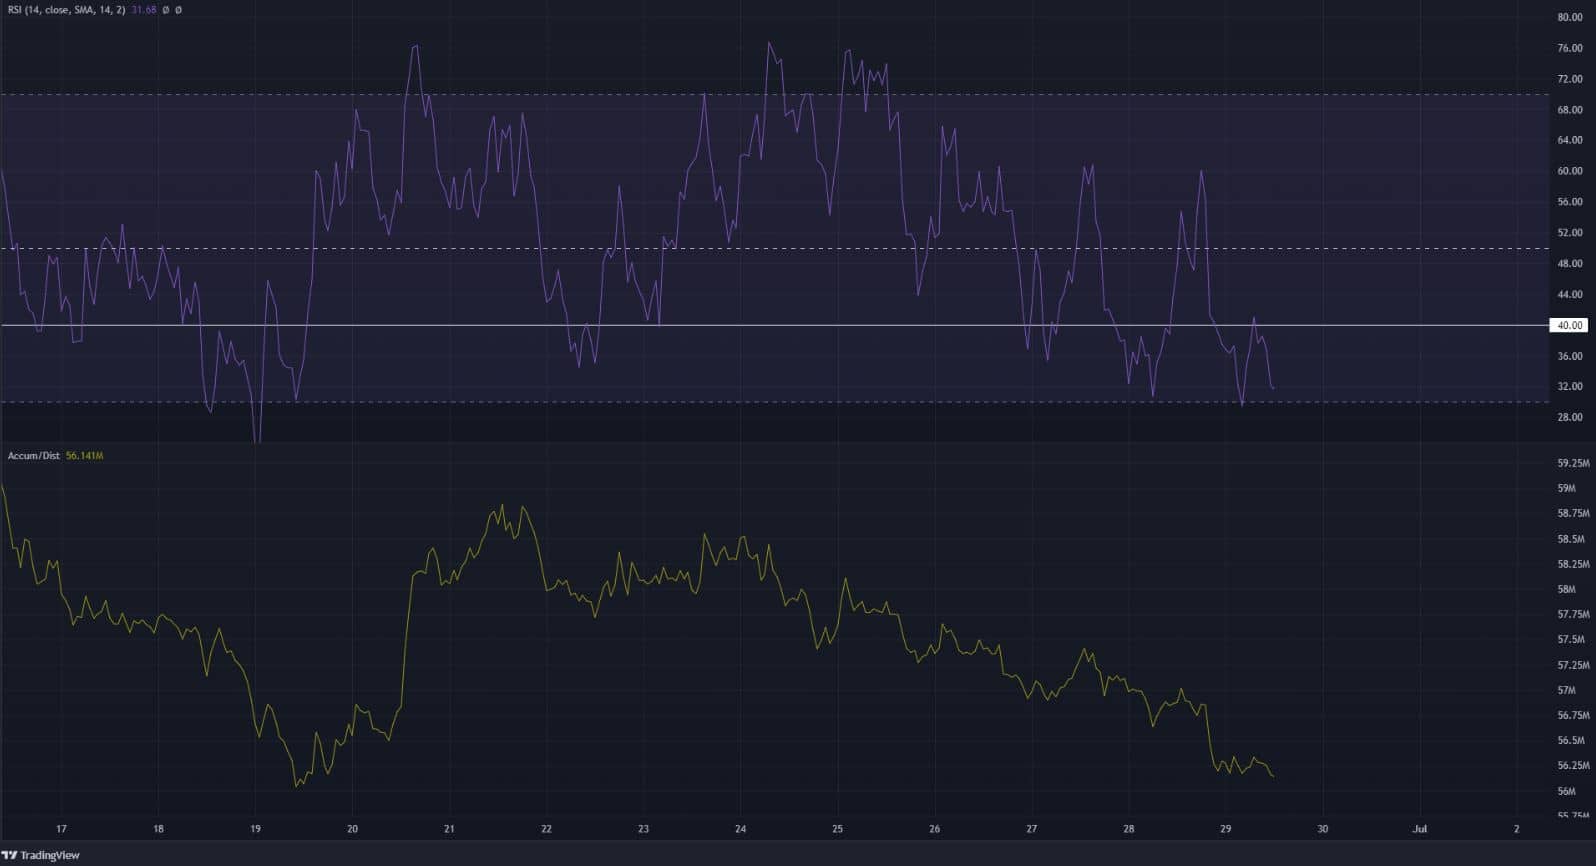
On the hourly chart, the RSI has been struggling to stay bullish over the past few days. It fell beneath the neutral 50 line. Its attempts to push back above the neutral 50 mark were halted at 60. Furthermore, the RSI slipped beneath the 40 mark as well to indicate strong bearish pressure.
At the same time, the Parabolic SAR gave a sell signal behind AVAX. The A/D line was also sloping downward, to indicate selling volume has been dominant over the past week.
Conclusion
The combination of the bearish momentum and heightened selling volume over the past few days suggested that AVAX could see a further downside. Even though the $18 area was a support zone, Bitcoin showed weakness on the charts. This meant that Avalanche could also face selling pressure over the next few days.


