For Bitcoin [BTC] traders, next resistance level could be at…

Disclaimer: The findings of the following analysis are the sole opinions of the writer and should not be considered investment advice.
In the first few days of July, Bitcoin [BTC] traded at a low of $18.8k. In the past two weeks, and especially the past week, Bitcoin has posted steady gains.
Bitcoin faced some resistance at the $24.2k, with further resistance ahead at the $26.7k-$27.1k area. The USDT dominance chart reached an area of support and looked likely to bounce.
Such a bounce would be indicative of selling pressure across the market, and market participants increasing their USDT holdings. News of Tesla selling 75% of their BTC holdings also affected the market bearishly in recent hours.
BTC- 1-Day Chart
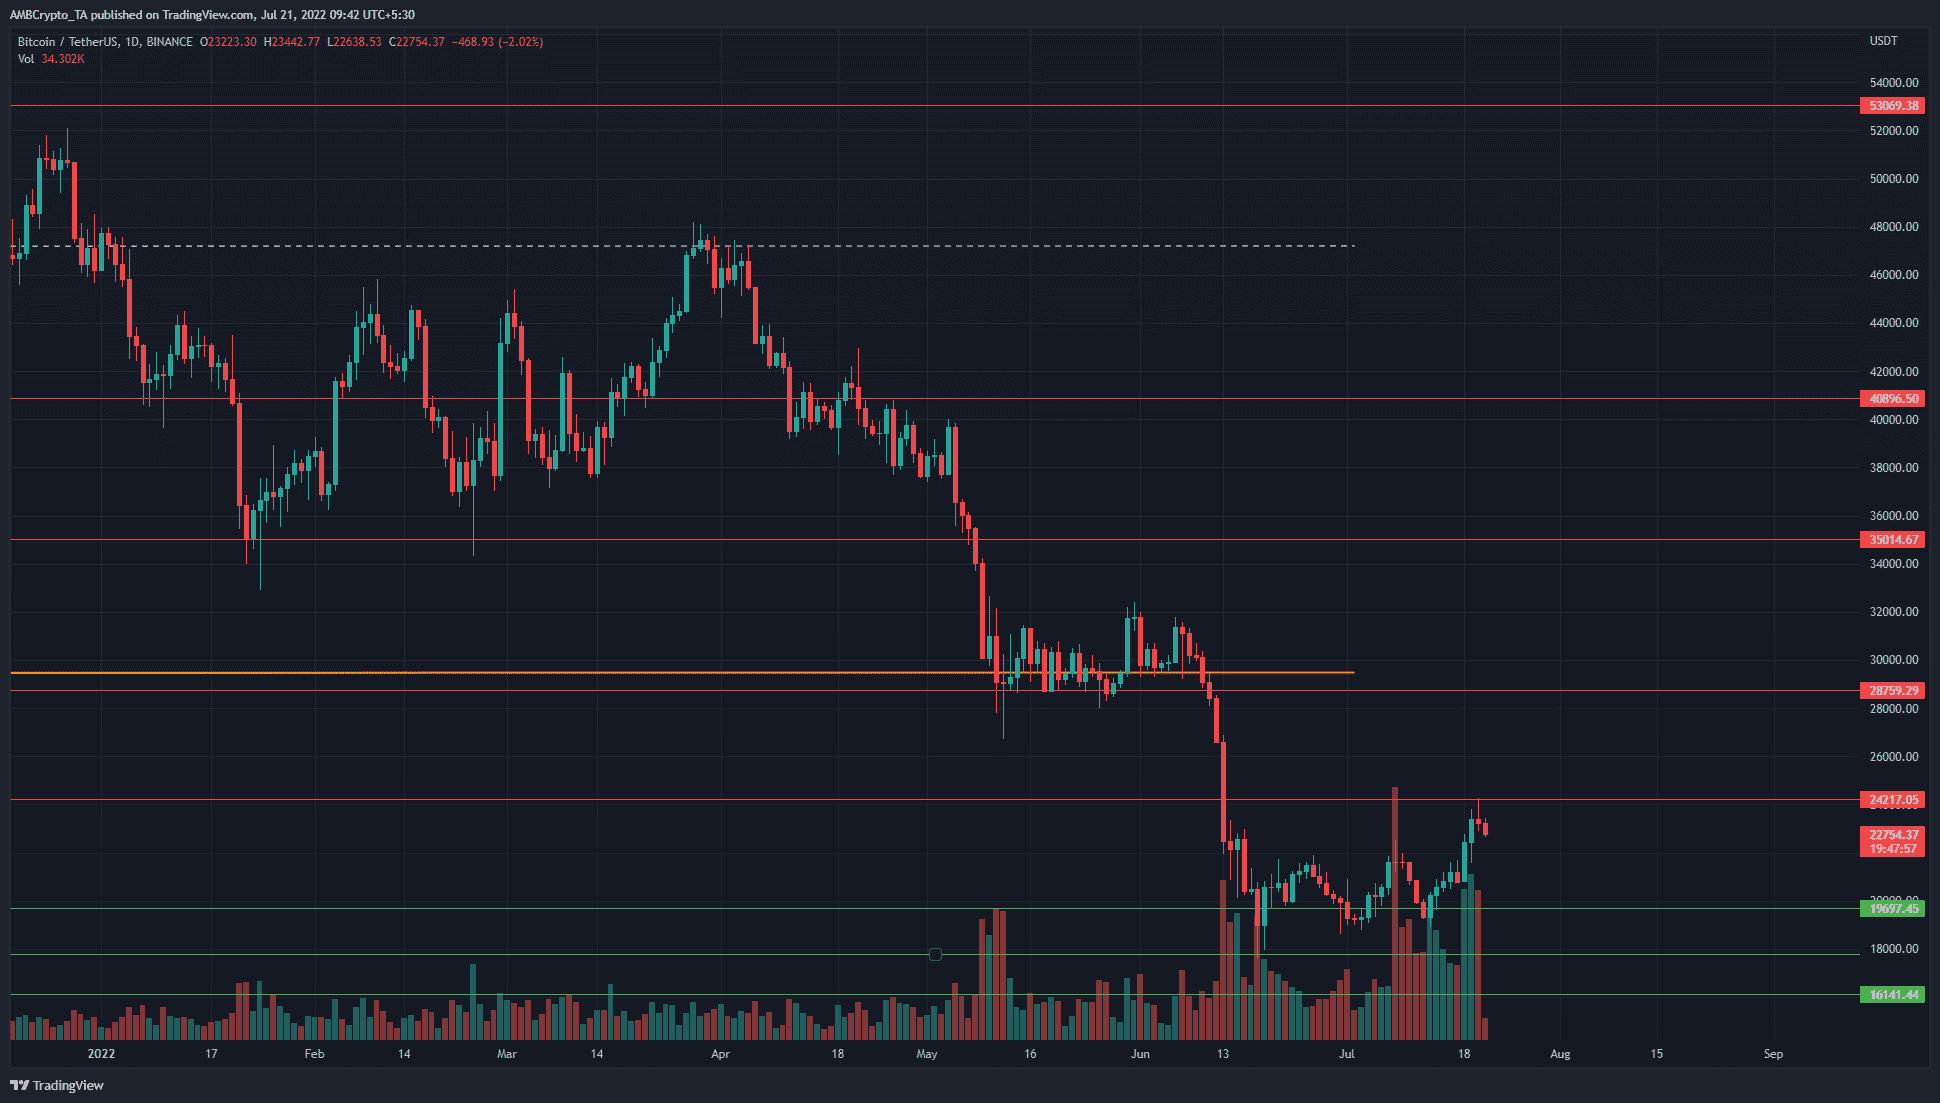
The long-term price chart showed a decisive downtrend for Bitcoin since December 2021. Bitcoin had formed a year-long range from $29.5k to $65k. In June, the price cratered beneath the range lows.
Even though the past week saw a strong Bitcoin rally that broke the lower highs at $23k and $22k, the trend was not yet firmly bullish. A lot more choppiness could be around the corner, which meant risky trading conditions.
Yet, it must be underlined that the break of the lower highs meant Bitcoin has a bullish structure and could rally higher, provided it can defend the $22k area. Hence, this zone would be one to watch out for.
Rationale
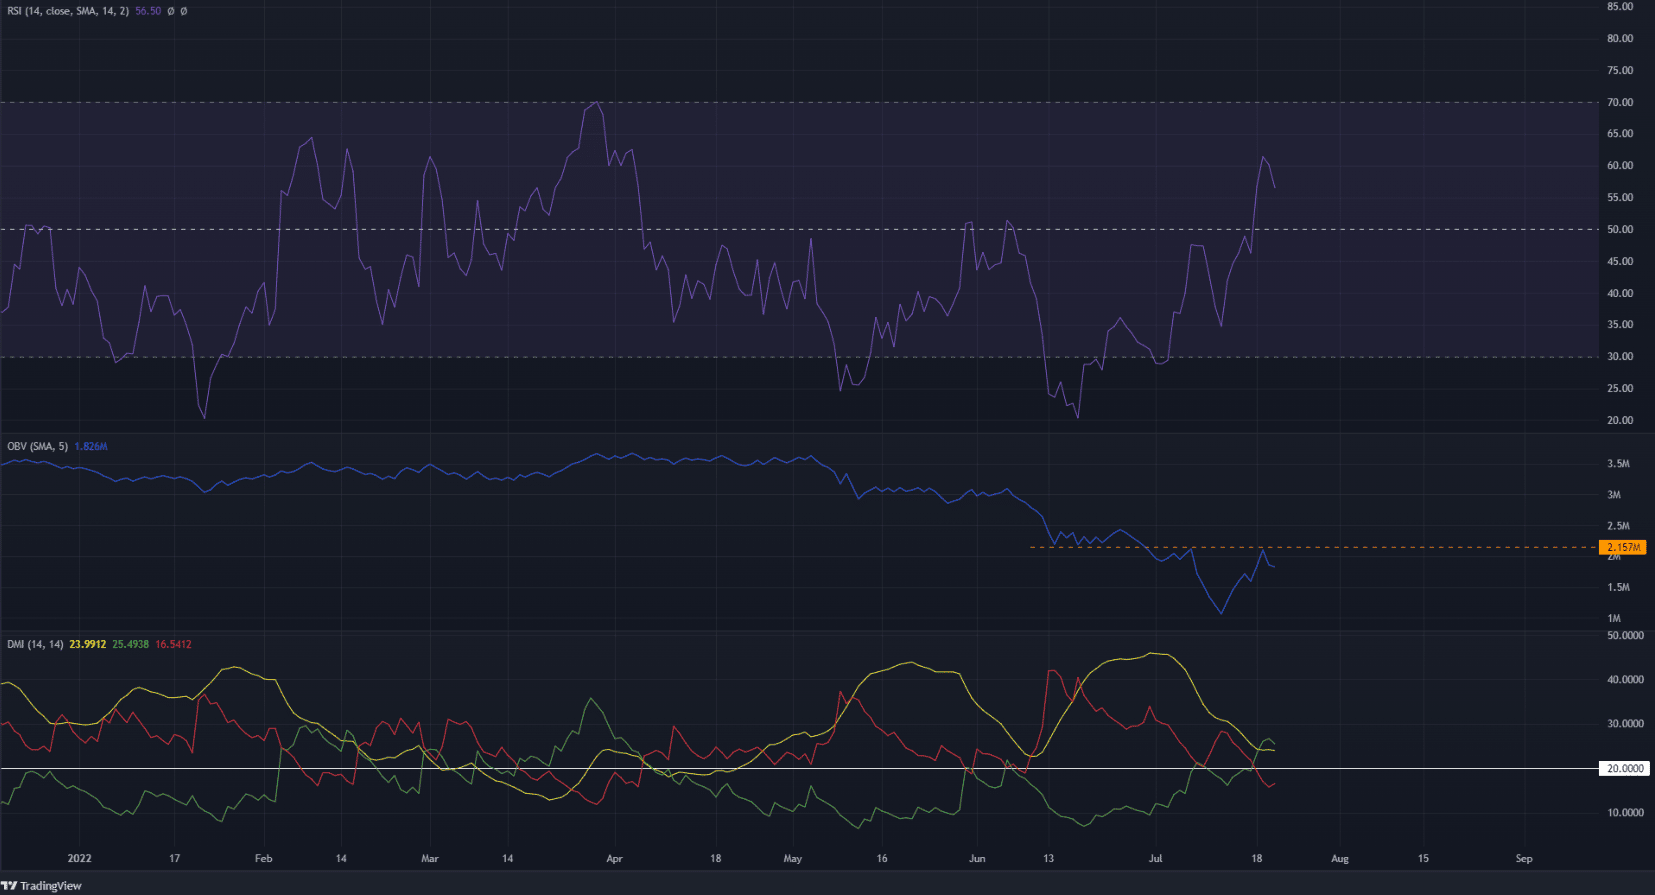
The Relative Strength Index (RSI) pushed above the neutral 50 line and past 60 as well, before a retreat. This showed that momentum could have shifted in favor of the bulls on the daily timeframe.
This also tied in with the market structure break. If the RSI managed to stay above neutral 50 and BTC can defend the $22k-$22.3k area, it was possible that the price would climb higher.
The On-Balance Volume (OBV) has been in a steady downtrend since April. The rally of the past two weeks only brought the OBV to a resistance level. This was not encouraging, as the OBV needed to break higher to indicate steady demand and an upward more.
The Directional Movement Index (DMI) showed a strong uptrend in progress, a reaction to the rally of the past two weeks. The ADX (yellow) and +DI (green) were above the 20 mark.
Conclusion
The indicators lag behind price but showed bullish momentum.
Buying volume was not yet overwhelming, and the break in OBV resistance would be a welcome sight for the buyers. The $22k-$22.3k was crucial support, and if defended, another leg higher could materialize.