For MATIC traders, the next support level to watch out for is at…

Disclaimer: The findings of the following analysis are the sole opinions of the writer and should not be considered investment advice.
Polygon [MATIC] has made strides in going green, but on the chart, red dominated. MATIC had a huge rally that began ten days ago and saw the asset post gains of more than 80% within a week. However, a good portion of those gains was in the process of being shed at press time. The buyers appeared to lack strength in the market, and fear was on the rise once more.
MATIC- 1 Hour Chart
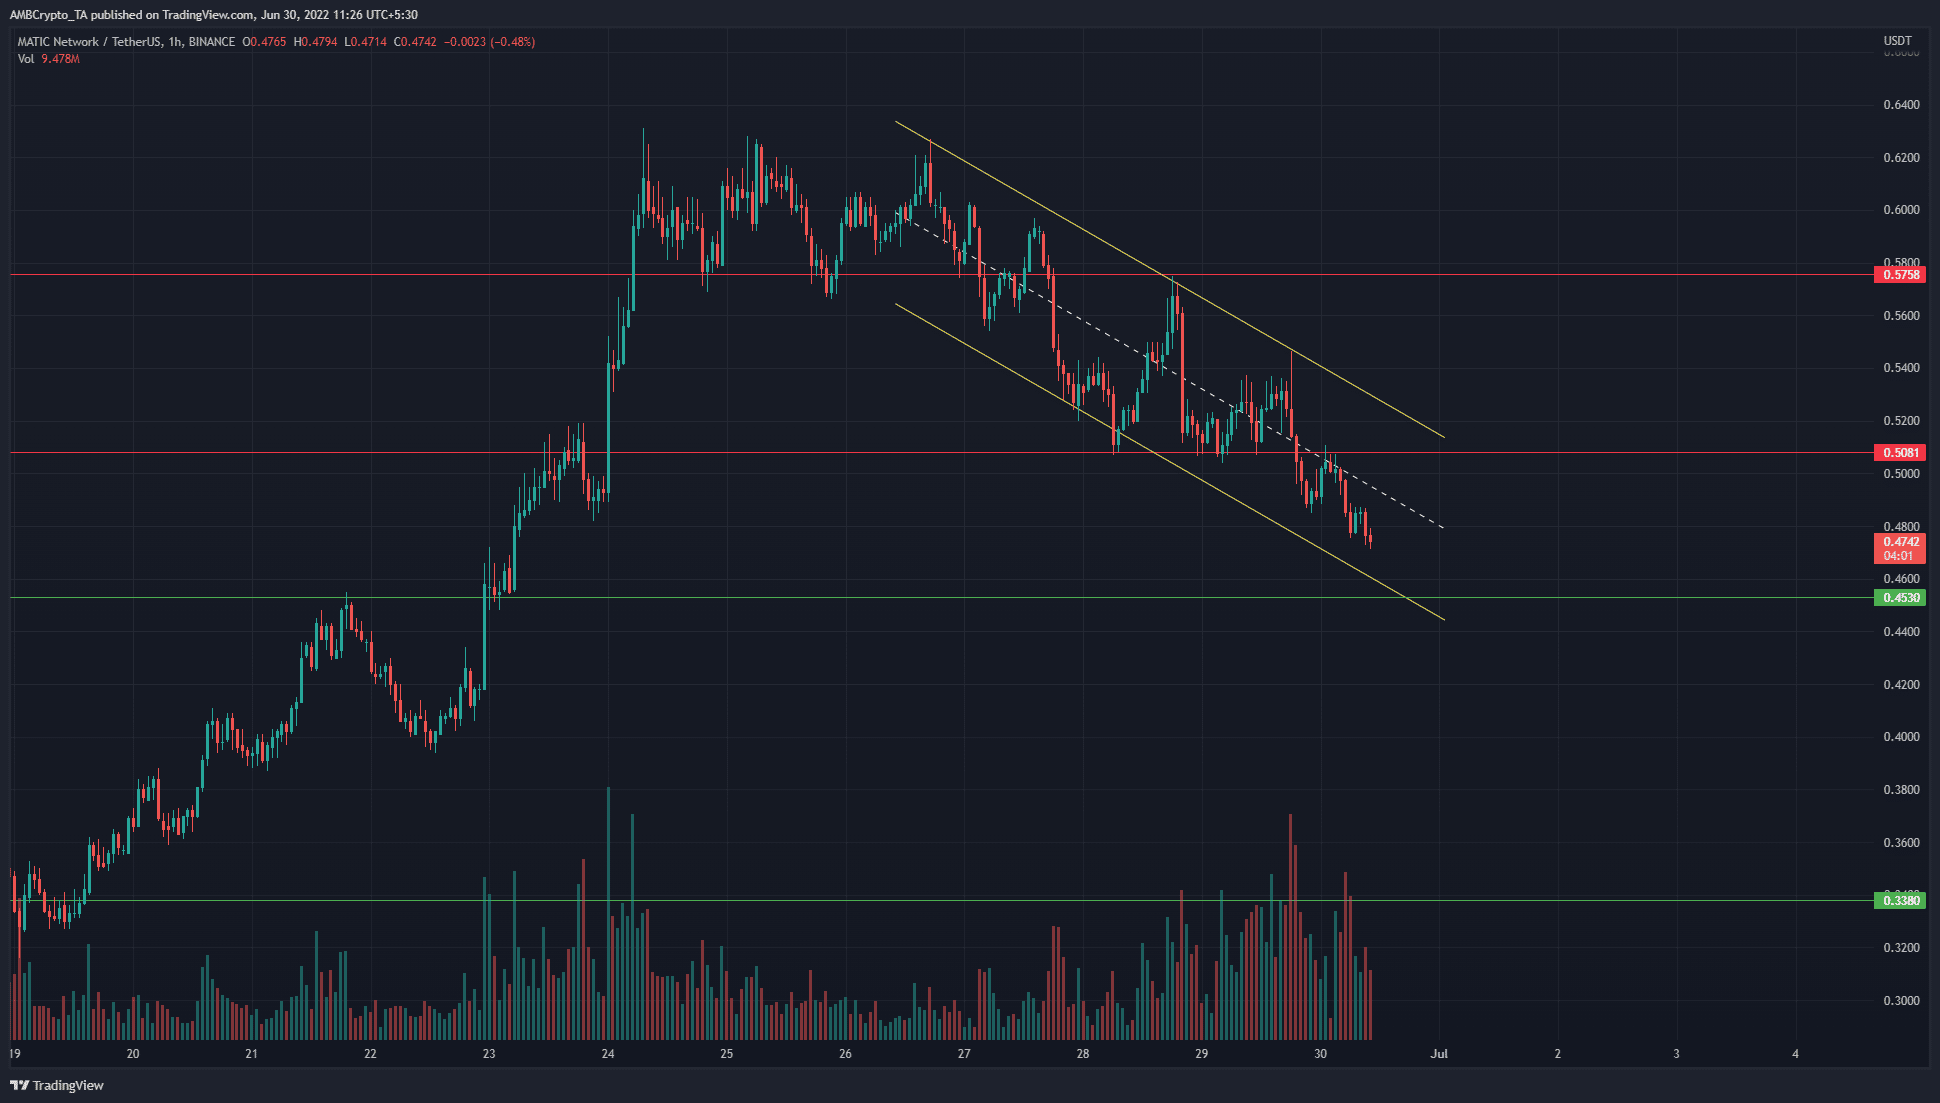
The price formed a descending channel (yellow). It has already retested the $0.57 and $0.5 levels as resistance. A few days ago these were levels of support. However, the selling pressure has been strong recently. This caused a short-term bearish move.
MATIC had a nearly 85% rally from the $0.33 lows to reach $0.62 but has been moving lower on the charts since. The longer-term trend for MATIC has been downward. Since January 2022, the coin has been bleeding on the charts.
There have been times of tranquility and sideways trading. From mid-May to mid-June, there was a period of about four weeks where the price established a range. Therefore, shorter-term rallies, even significant ones like 80%, do not mean that the longer-term bearish trend has been reversed.
Rationale
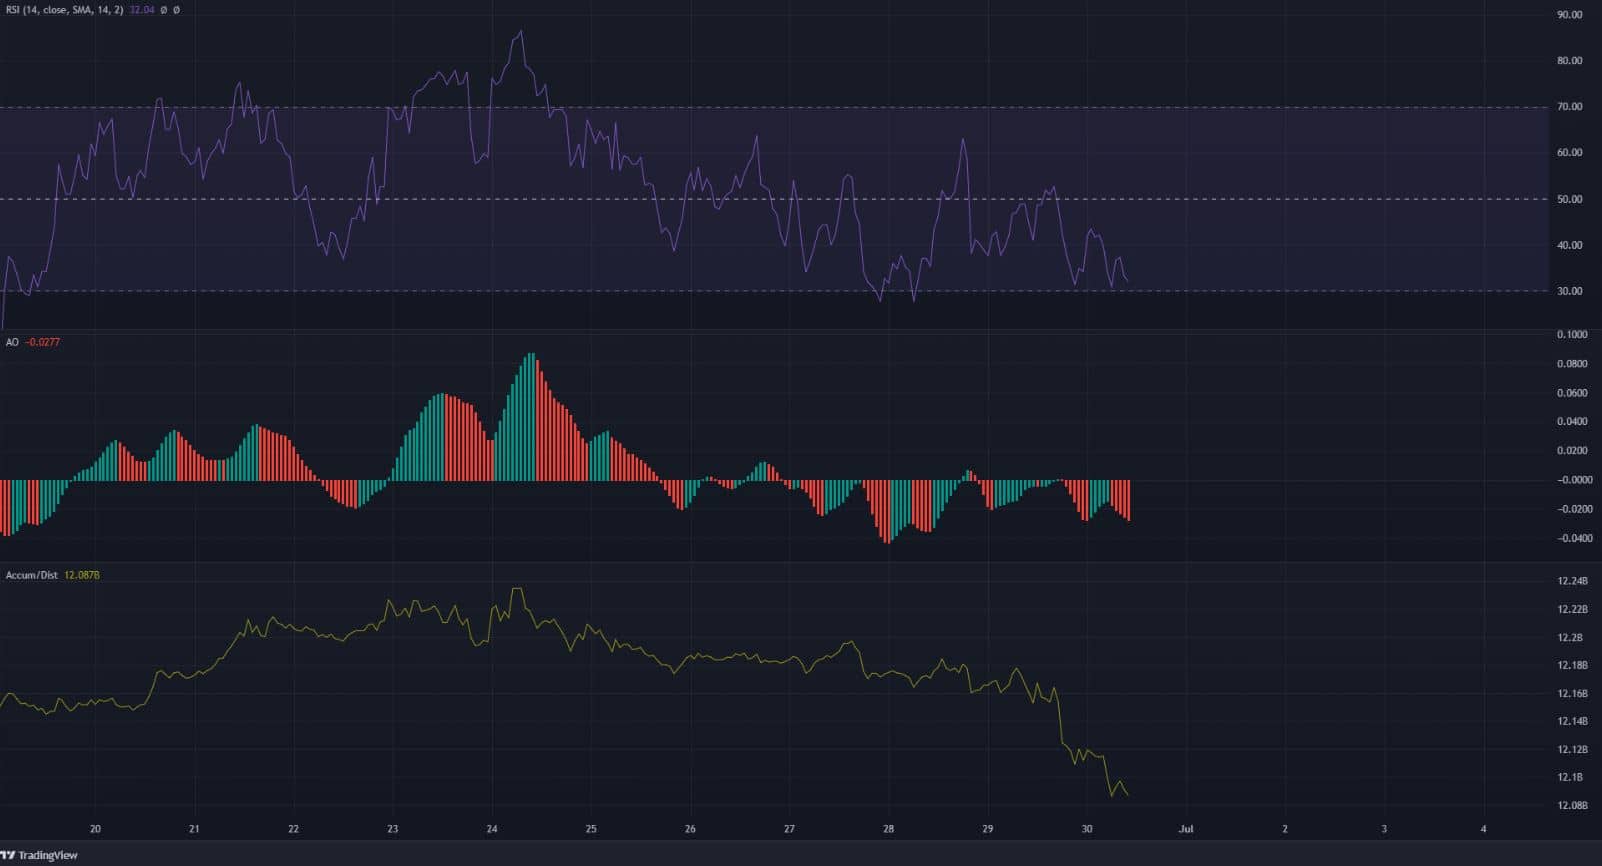
The hourly indicators showed strong bearish momentum. The Relative Strength Index (RSI) stood at 32 and has been moving below the neutral 50 line for almost four days. Similarly, the Awesome Oscillator (AO) has also been below the zero line for a good portion of the past week.
The A/D line has dropped lower and lower on the charts over the past week. It formed a series of lower highs to indicate that selling pressure was dominant in the market.
Conclusion
The indicators highlighted that selling pressure was on the rise once more. Bitcoin was also struggling to hold on to the $20k mark. It lost the $20.8k level of former support recently, and another move lower might be around the corner. This could drag an already weak MATIC lower on the price charts.