Going long on Solana [SOL]? Here’s what investors must know…

Disclaimer: The findings of the following analysis are the sole opinions of the writer and should not be considered investment advice
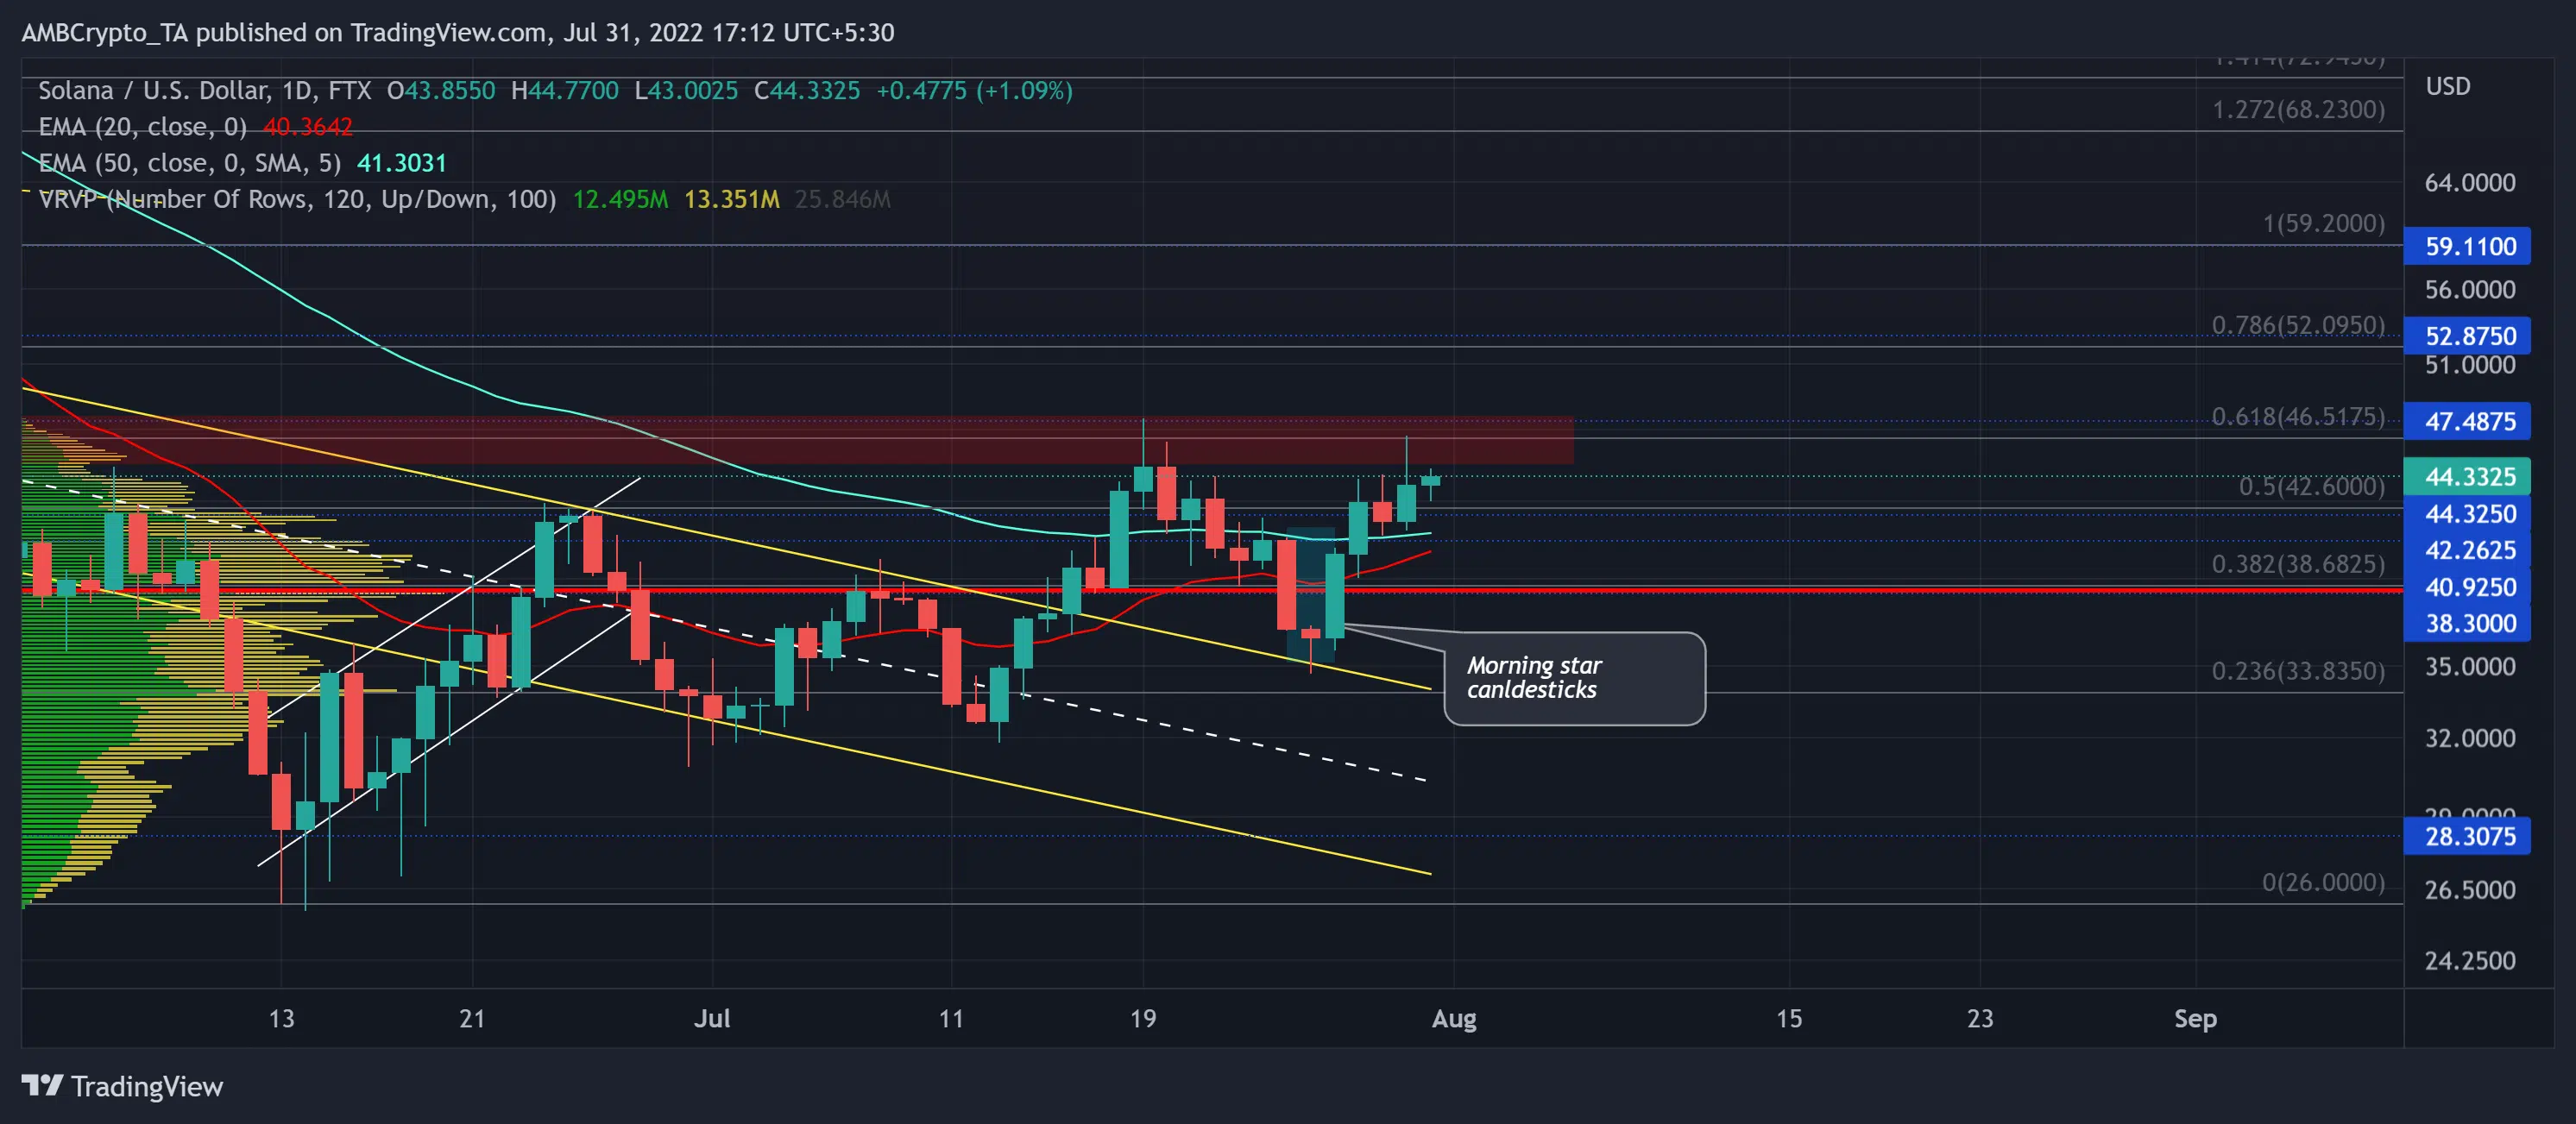
Solana’s [SOL] down-channel oscillation finally transposed into a breakout rally, one that helped buyers retest the immediate supply zone over the last ten days. The close above the 20 EMA (red) and the 50 EMA (cyan) reignited the near-term bullish inclinations.
The consistent efforts of buyers to breach the 61.8% Fibonacci level could translate into a bull rally. The bulls, however, still need more firepower to find a sustained position above the supply zone.
At press time, SOL was trading at $44.3325, up by 4.43% in the last 24 hours.
SOL Daily Chart
SOL’s descent phase extended itself all the way towards the $28-mark support. With buyers willing to reject further lower prices, the altcoin broke out of its long-term down-channel (yellow).
This bullish break helped the buyers test the 61.8% Fibonacci resistance before retesting the upper trendline of the down channel. The bullish resurgence from there provoked a morning star candlestick pattern. This setup aided the buyers in jumping above the north-looking 20/50 EMA.
Traders/investors should look for a potential bullish crossover on these EMAs to identify the chances of a sustained recovery beyond the $46.5 zone.
The price action later saw a minor rejection of higher prices near the supply zone. A reversal from this level would confirm a bearish hammer on the daily timeframe. In this case, SOL would fall back to retest the Point of Control (POC, red) near the $38-level.
However, a close beyond the 61.8% level could position the alt for testing the $52-region near the 78.6% resistance.
Rationale
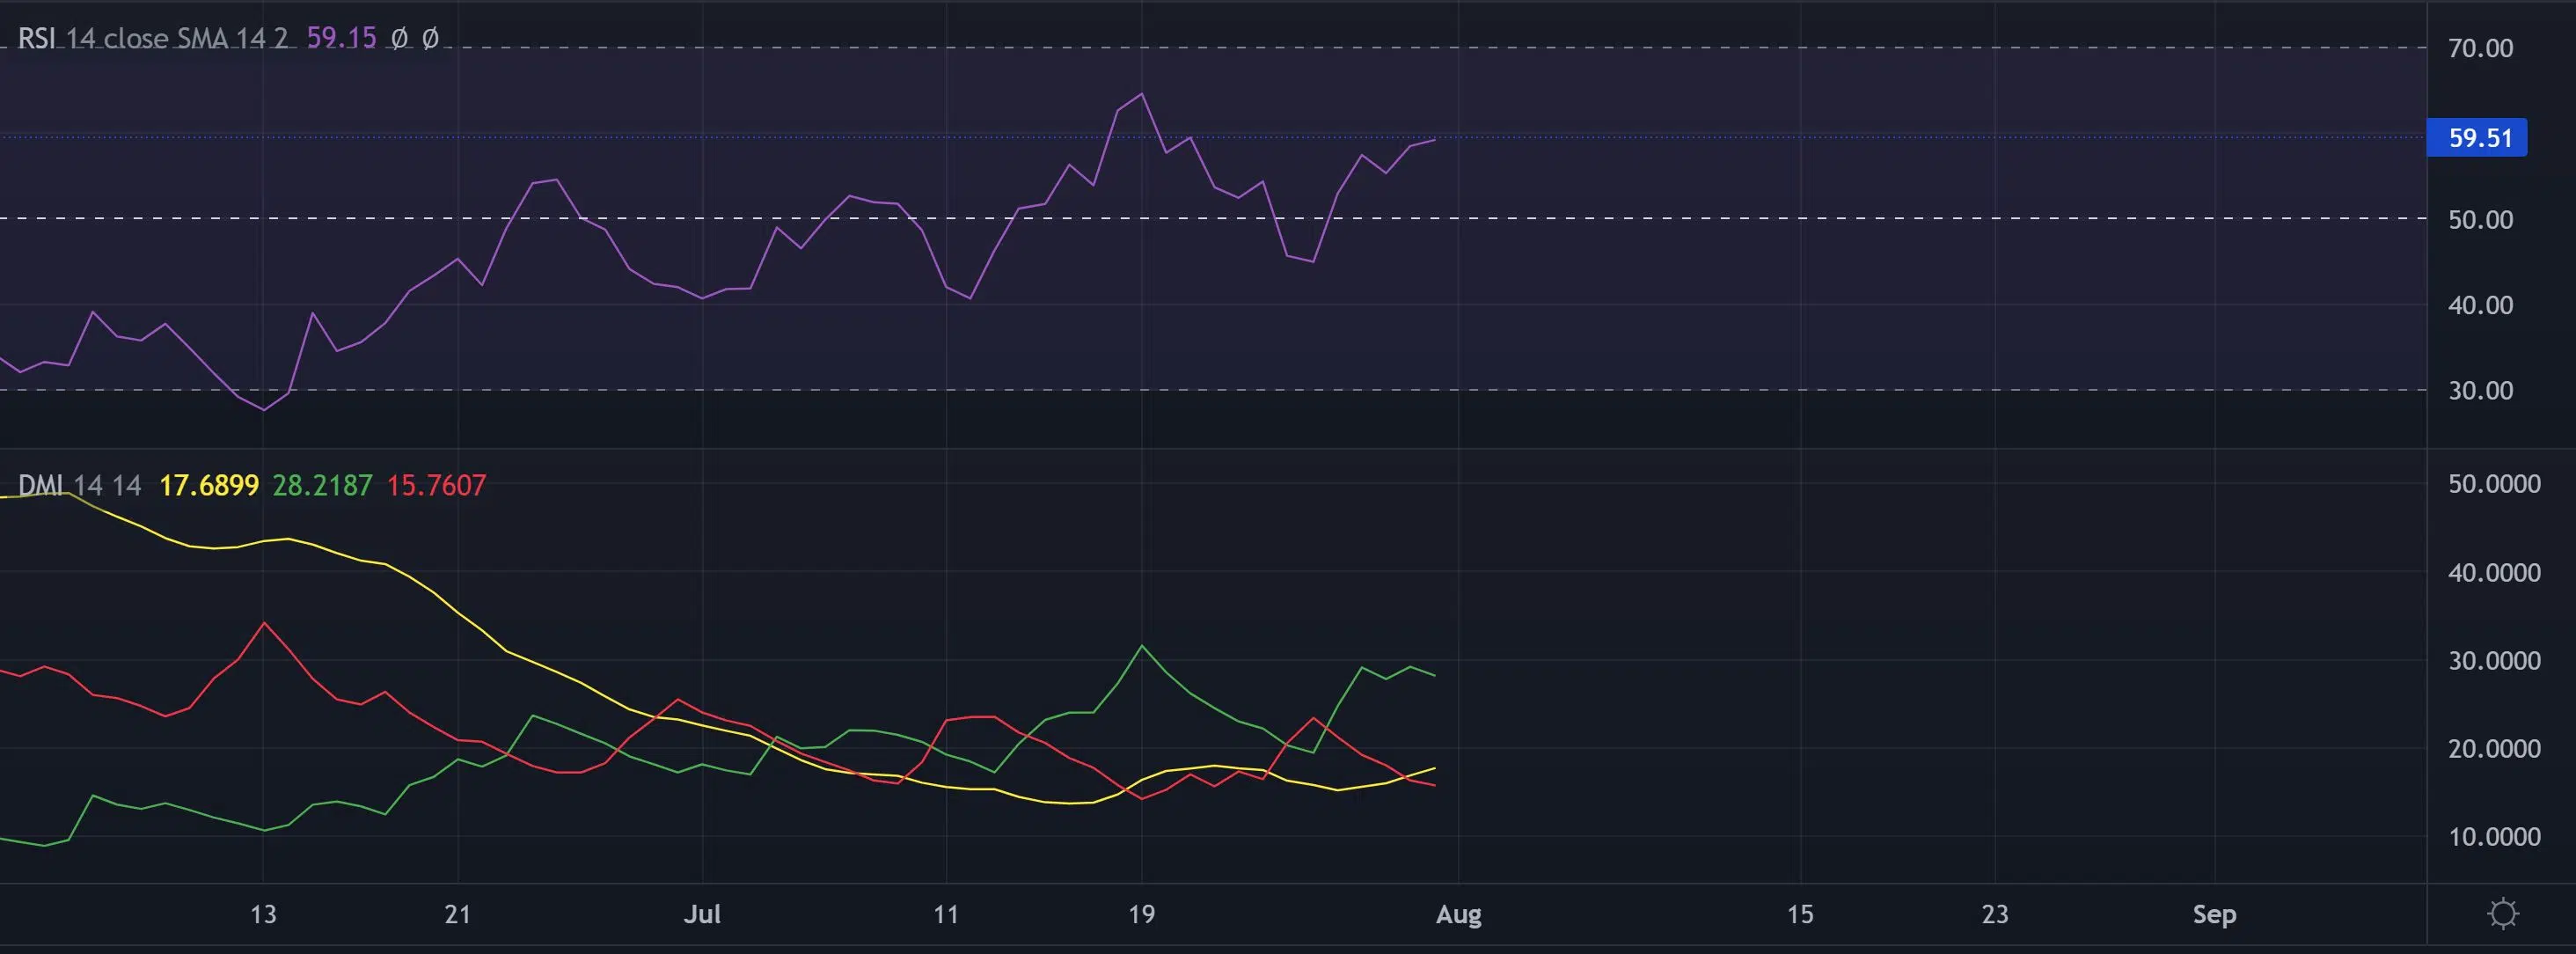
The Relative Strength Index (RSI) found a solid spot above equilibrium over the last few days. An inability to close beyond the 59-60 resistance range can help sellers keep buying pressure under their check.
The DMI lines flashed a strong buying edge as the +DI swayed well above its counterpart. However, the ADX displayed a considerably weak directional trend for the altcoin.
Conclusion
In view of the bullish break above the northbound 20/50 EMA, SOL could see a continued revival while facing a hurdle near the supply zone. A bullish crossover on the EMAs and an uptick in volumes could further give a reliable confirmation. The triggers and take-profit levels would remain the same as above.
Finally, investors/traders must keep a close eye on Bitcoin’s movement to determine its effects on the broader sentiment.


