Hark, ZEC bulls, here’s why a move toward $66 could soon materialize

Disclaimer: The findings of the following analysis are the sole opinions of the writer and should not be considered investment advice.
The Tether Dominance metric has been on an uptrend over the past few days. This came in the wake of strong selling across the crypto market, and participants fled to stablecoins.
Zcash moved in tandem with many other altcoins as it shed 13.15% in under five days. Yet, the technical analysis showed that a buying opportunity with a clear downside invalidation was around the corner. Can the bulls succeed in driving prices back to the $66 mark?
ZEC- 12-Hour Chart
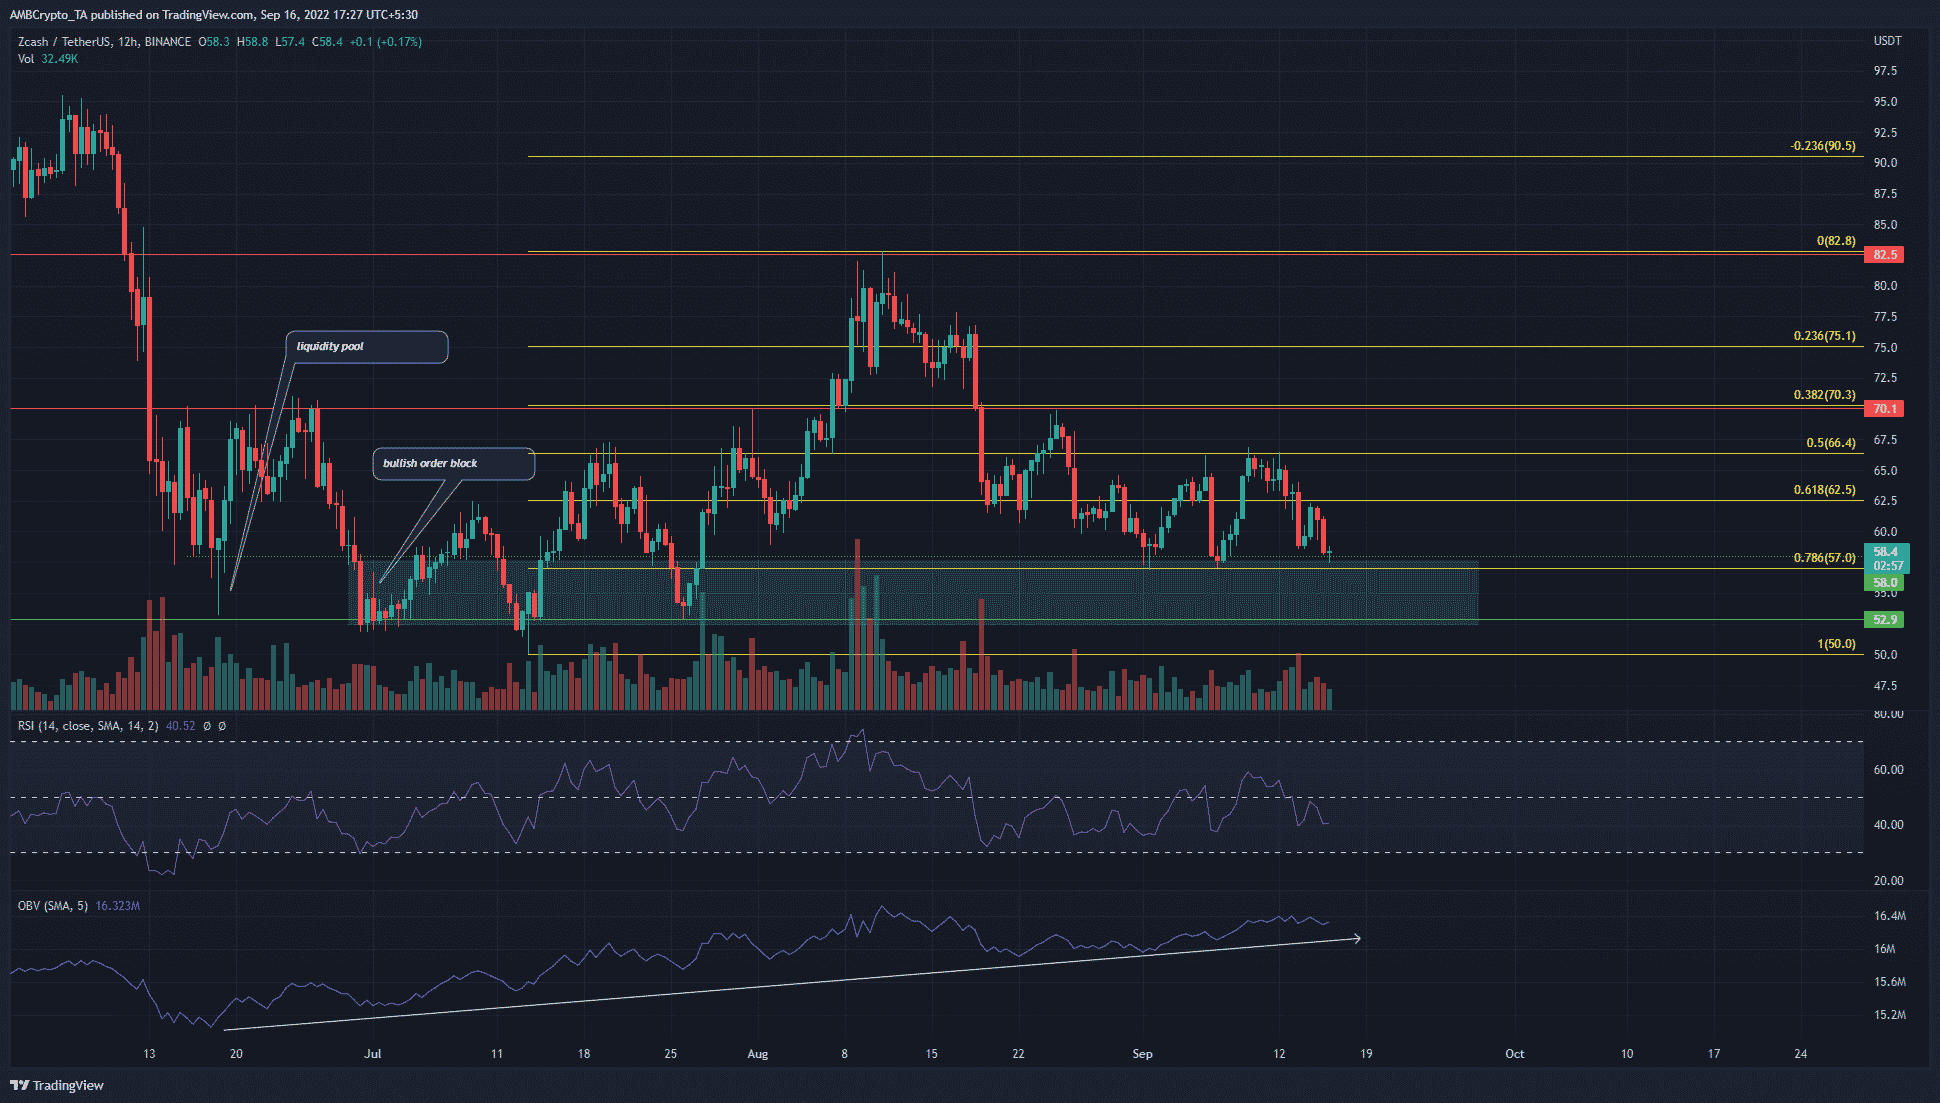
The Fibonacci retracement levels (yellow) were plotted based on ZEC’s move up from $50 to $82.8. The tool showed the 78.6% retracement level of this move to be at $57, which was quite close to the $58 horizontal support level. Moreover, both of these levels have been respected in recent weeks as strong support.
In late June, the $53-$58 area (marked in cyan) developed to be a bullish order block. It has been an area where the buyers have managed to force good rallies.
Over the next week or so, history could repeat itself. The OBV has also been in an uptrend since June, which meant buying volume has been steady and persistently stronger than selling pressure.
On the other hand, repeated tests of a support level tend to weaken it. A daily session close below $58 would likely see ZEC dip further to $55 and $53, where another buying opportunity could arise.
Yet, the momentum remained with the sellers, as the RSI has not been able to rise above the 50 mark and stay above. Invalidation of the bullish would be a drop below $52.9.
ZEC- 2-Hour Chart
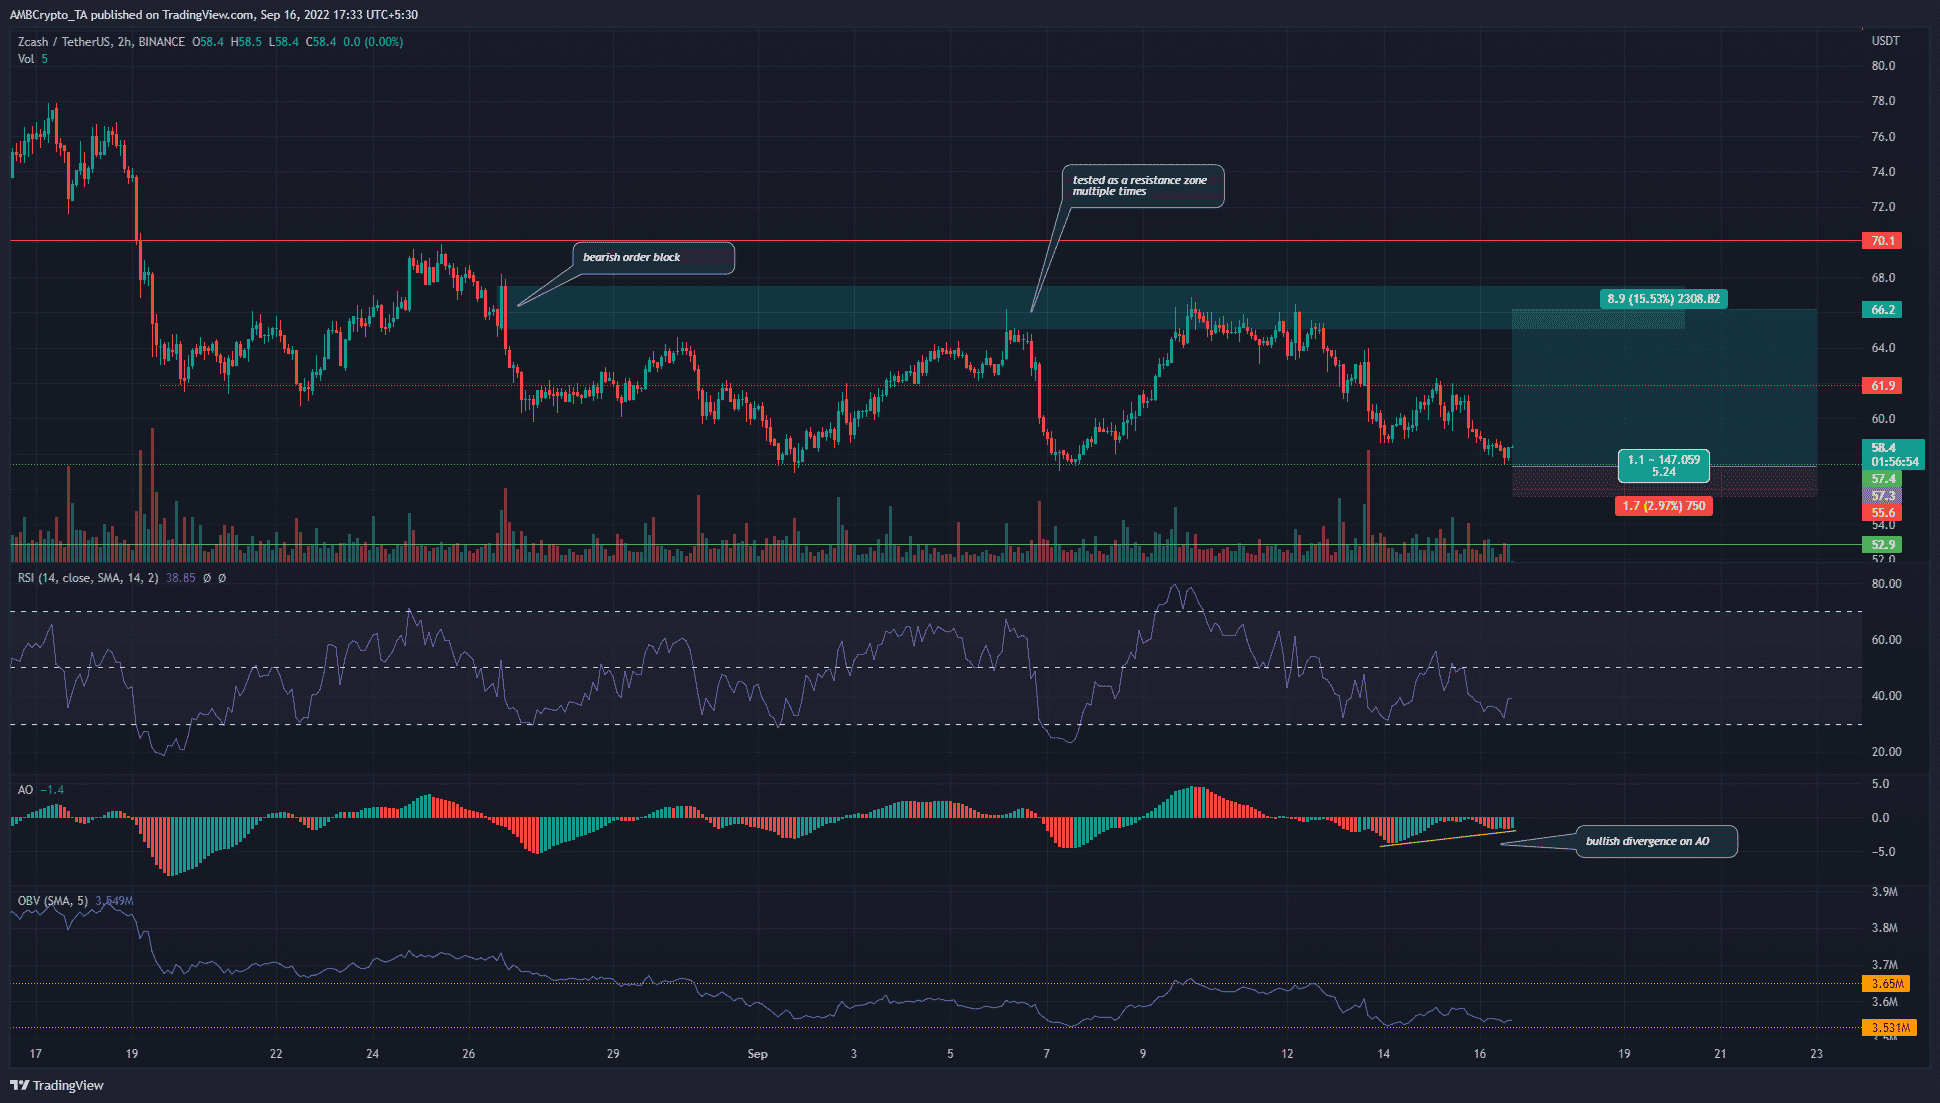
The 2-hour chart highlighted the lack of a strong trend in the past three weeks. The $66.7 area, once more highlighted in cyan, was a bearish order block from late August. Moreover, the same area has been tested twice since then as a resistance band.
ZEC has ranged between $66.2 and $57.4 since late August. This could remain unchanged. The OBV was also stuck within a range to reinforce the notion of a balance between buying and selling volume.
Yet, the Awesome Oscillator showed a bullish divergence. Both the RSI and the AO showed bearish momentum. As the price headed into a support level, the momentum could begin to reverse.
Conclusion
Selling pressure behind Bitcoin has been strong in recent weeks, and that could stay the same way heading into the weekend. Therefore, any long positions on Zcash could be inherently risky. Ethereum also fell below $1500, and the fear in the market could force further losses.


