Has Binance Coin formed a short-term double bottom

Binance Coin is one of the most popular exchange tokens, and the Binance Smart Chain craze in August earlier this year saw the network outperform the Ethereum network on several on-chain metrics. Over the past few days, Binance Coin has dropped below the $530 mark and was unable to pick itself back up. However, the $510 level has been established as a strong support level. Will BNB bulls be able to drive prices higher over the coming days?
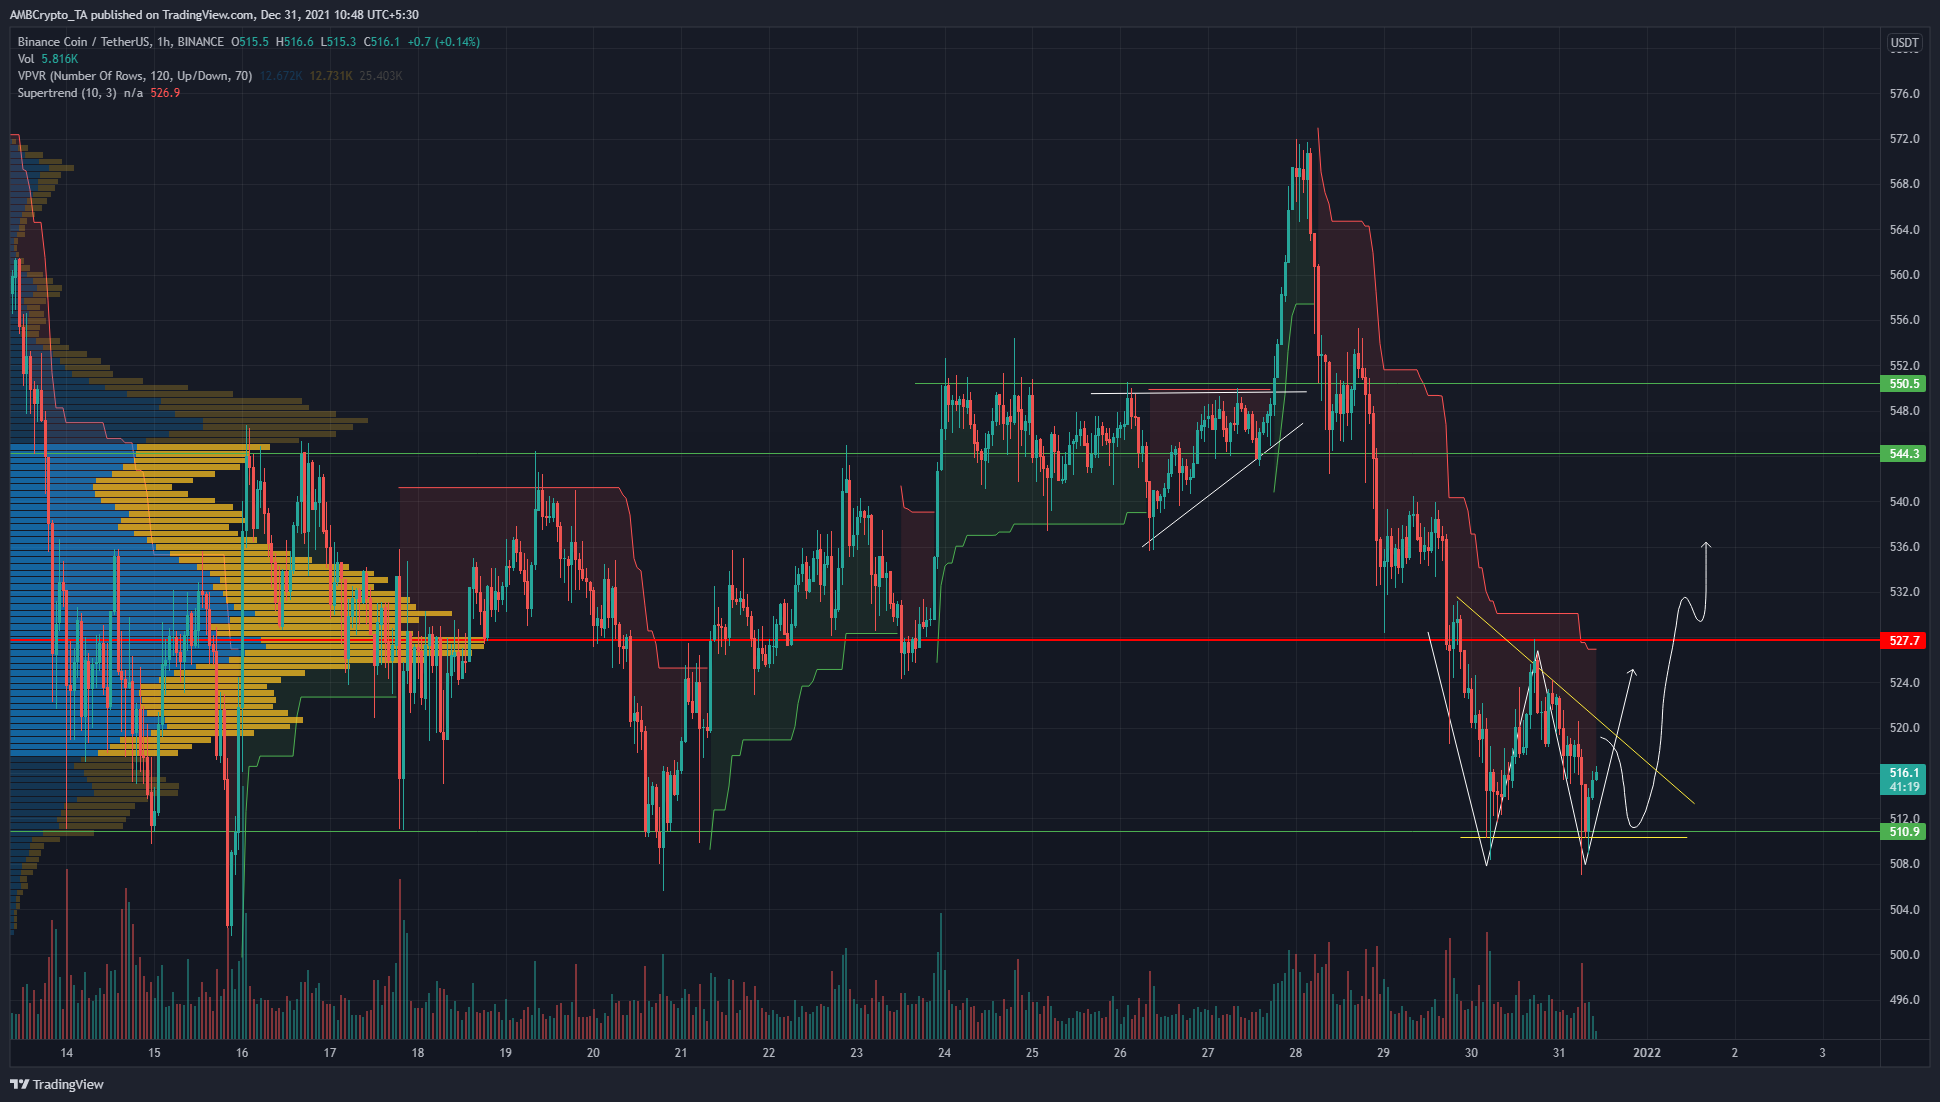
The price action of the past few days saw BNB crash from the $550 area to reach $510 support. This was alongside a sliding Bitcoin. However, BTC appeared to have found some short-term buyers, and this could see BNB bounce as well.
The price tested the $510 level twice, forming a possible double bottom pattern (white). Alongside, a descending triangle pattern (yellow) was also seen.
The Visible Range Volume Profile showed that price was within the value area, and the Point of Control was at $527. This marked $527 as a significant level of resistance for bulls to overcome. However, before that, the price has to enforce a triangle breakout and climb past $525, which has acted as a level of significance over the past month.
Rationale

The Supertrend indicator continued to show a sell signal for BNB on the hourly chart. The MACD was also moving below the zero line, an effect of the selling pressure of recent days. The MACD also showed a hidden bearish divergence, as the price made a lower high while the MACD made a higher high (white).
The Directional Movement Index also showed a bearish trend was strongly in progress.
Conclusion
While momentum has been on the side of the bears, the $510 level has acted as support since October and has seen strong demand step in. Repeated tests of the $510 over the past couple of days would have depleted the demand. However, it is still an area that represented a good risk-to-reward zone to enter long positions.
The descending triangle pattern and its subsequent breakout could play out, as indicated in white. A retest of the $510 region can be bought, targeting $530 as a take-profit level. $545-$550 was also possible if Bitcoin managed to bounce past the $48k region.