Has Bitcoin staunched its bleeding, or can further downside be expected

Disclaimer: The findings of the following analysis are the sole opinions of the writer and should not be considered investment advice
Could a death cross on the price charts of Bitcoin usher in new lows for the year 2022 for the king of crypto? Alternatively, can news such as Grayscale’s ETF applications to the US SEC and the firm’s confidence in a positive outcome in the next few weeks turn the bearish tide?
The Federal Reserve could continue to increase interest rates, and the effect on the crypto market could be bearish in the weeks to come. The charts also pointed toward another push southward.
BTC- 12 Hour Chart
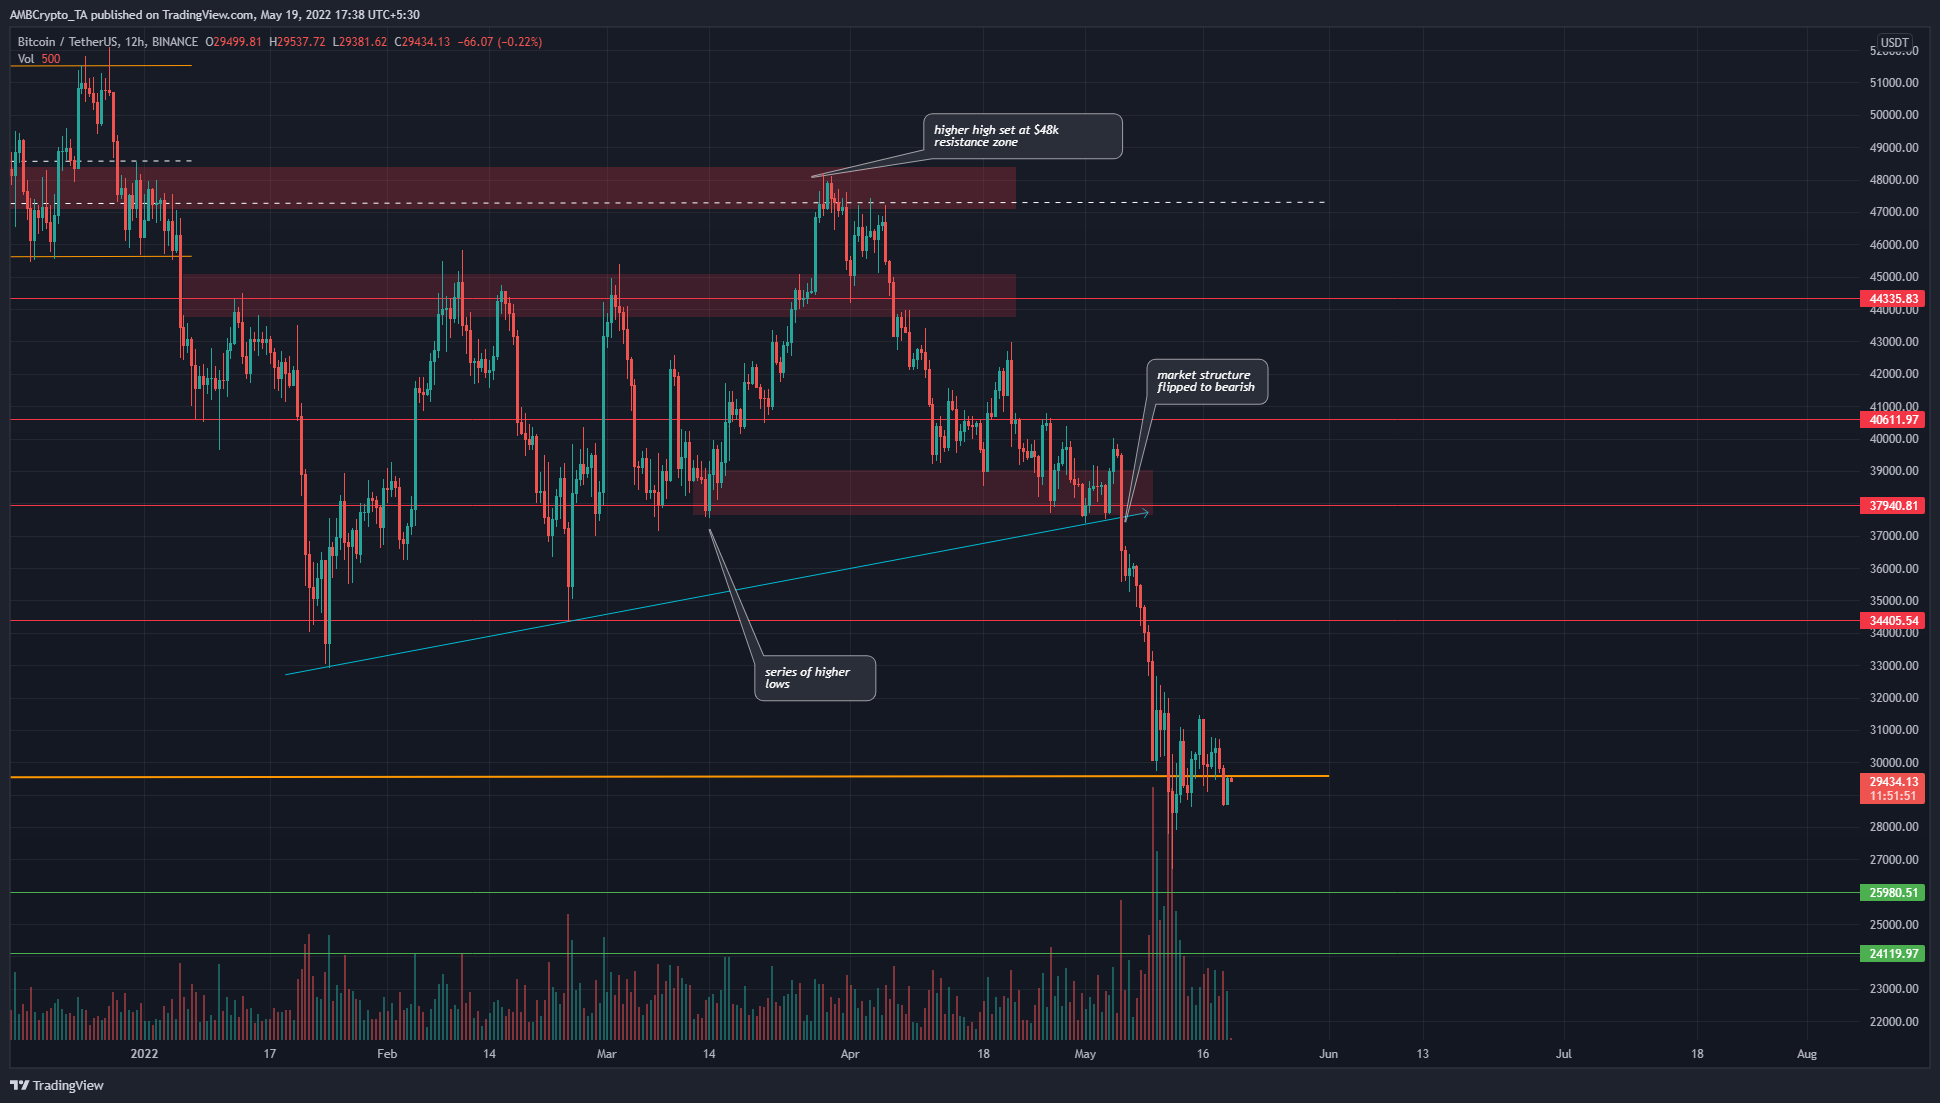
As per the charts, we can see that when Bitcoin broke above the $44k mark in February 2022, and simultaneously set a series of higher lows, the technical structure had a bullish bias to it, and it was expected that the $48k would offer stiff resistance to BTC on its way up.
However, upon the rejection at $48k, the $45k nor the $40k demand areas were able to stave off the selling pressure since late March. In April, Bitcoin saw a slow bleed from $45k to $37.9k, and in May there was a free-fall beneath the $40k area, and a drop as far south as the $26k-$27k levels.
This meant that the nearly 18-month range from $29.5k-$64k has been breached. The trading volume of the past couple of weeks was enormous. Although buyers were able to absorb the cascade toward $26k, do they possess the strength to cause a reversal?
Rationale
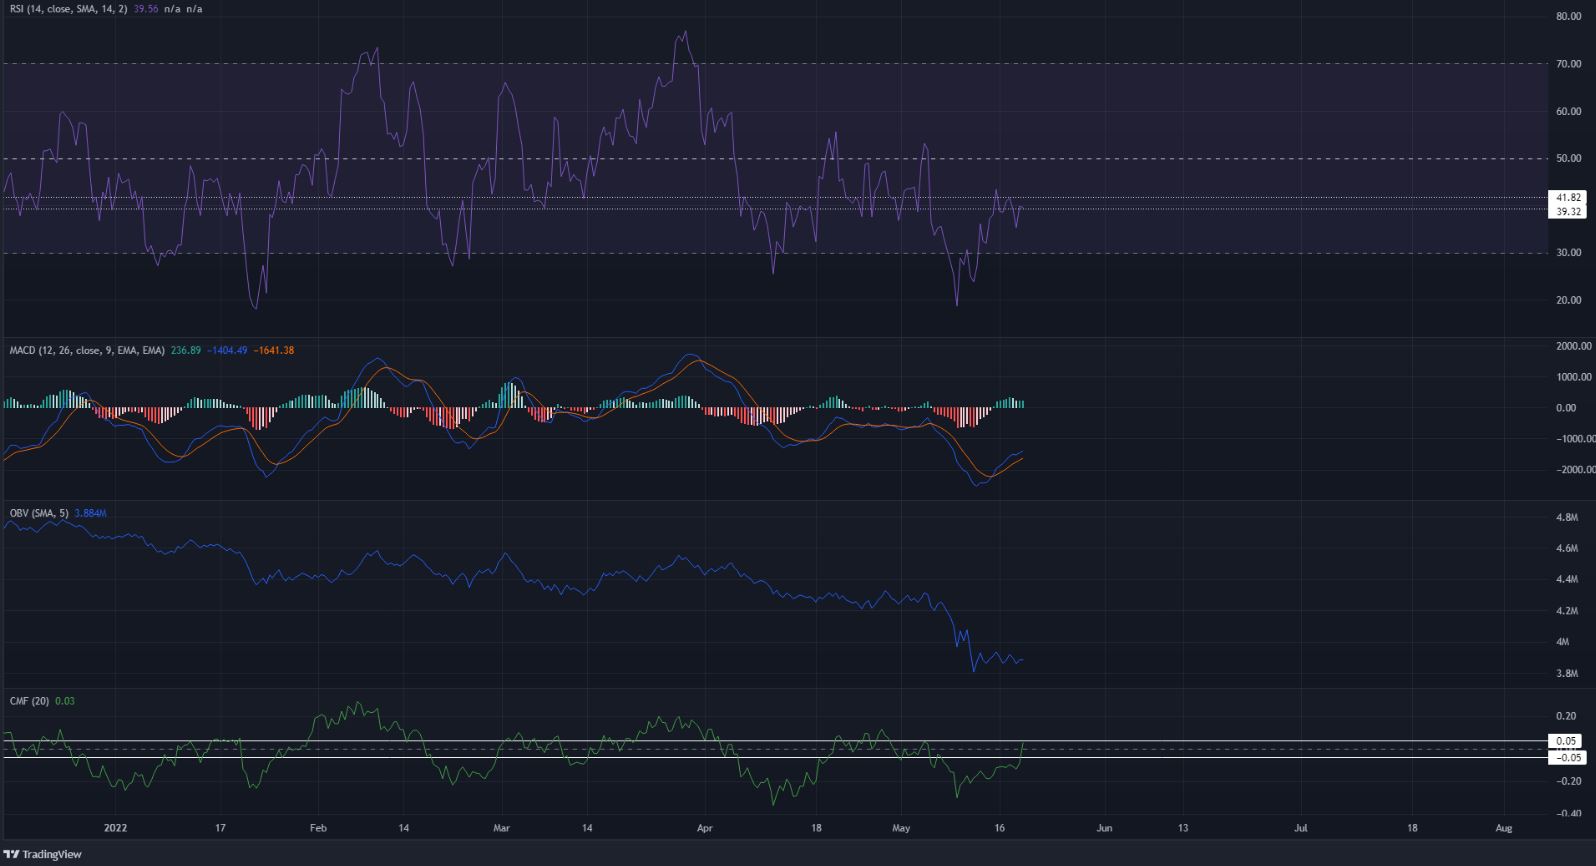
The RSI on the 12-hour chart stood at 39.5, which indicated bearish momentum behind BTC. The 39-42 values have been important in the past, and bulls would be hoping to drive the RSI further higher.
The MACD remained beneath the zero line and its bullish crossover suggested weakening bearish momentum. Yet, the OBV saw a severe dip in May, and another such drop can not be overruled. The CMF also pushed above -0.05 recently but it has remained below this mark for a good portion of the past six weeks, showing significant capital flow out of the market.
Conclusion
The $30k and the $24k area could be great opportunities to buy Bitcoin for a long-term investor. However, another drop below the $30k mark can not yet be ruled out, and investors must make plans for such a price drop.


![Three days ago, Uniswap [UNI] attempted a breakout from a parallel channel, surging to hit a local high of $7.6. However, the altcoin faced strong rejection.](https://ambcrypto.com/wp-content/uploads/2025/06/Gladys-83-400x240.jpg)
