
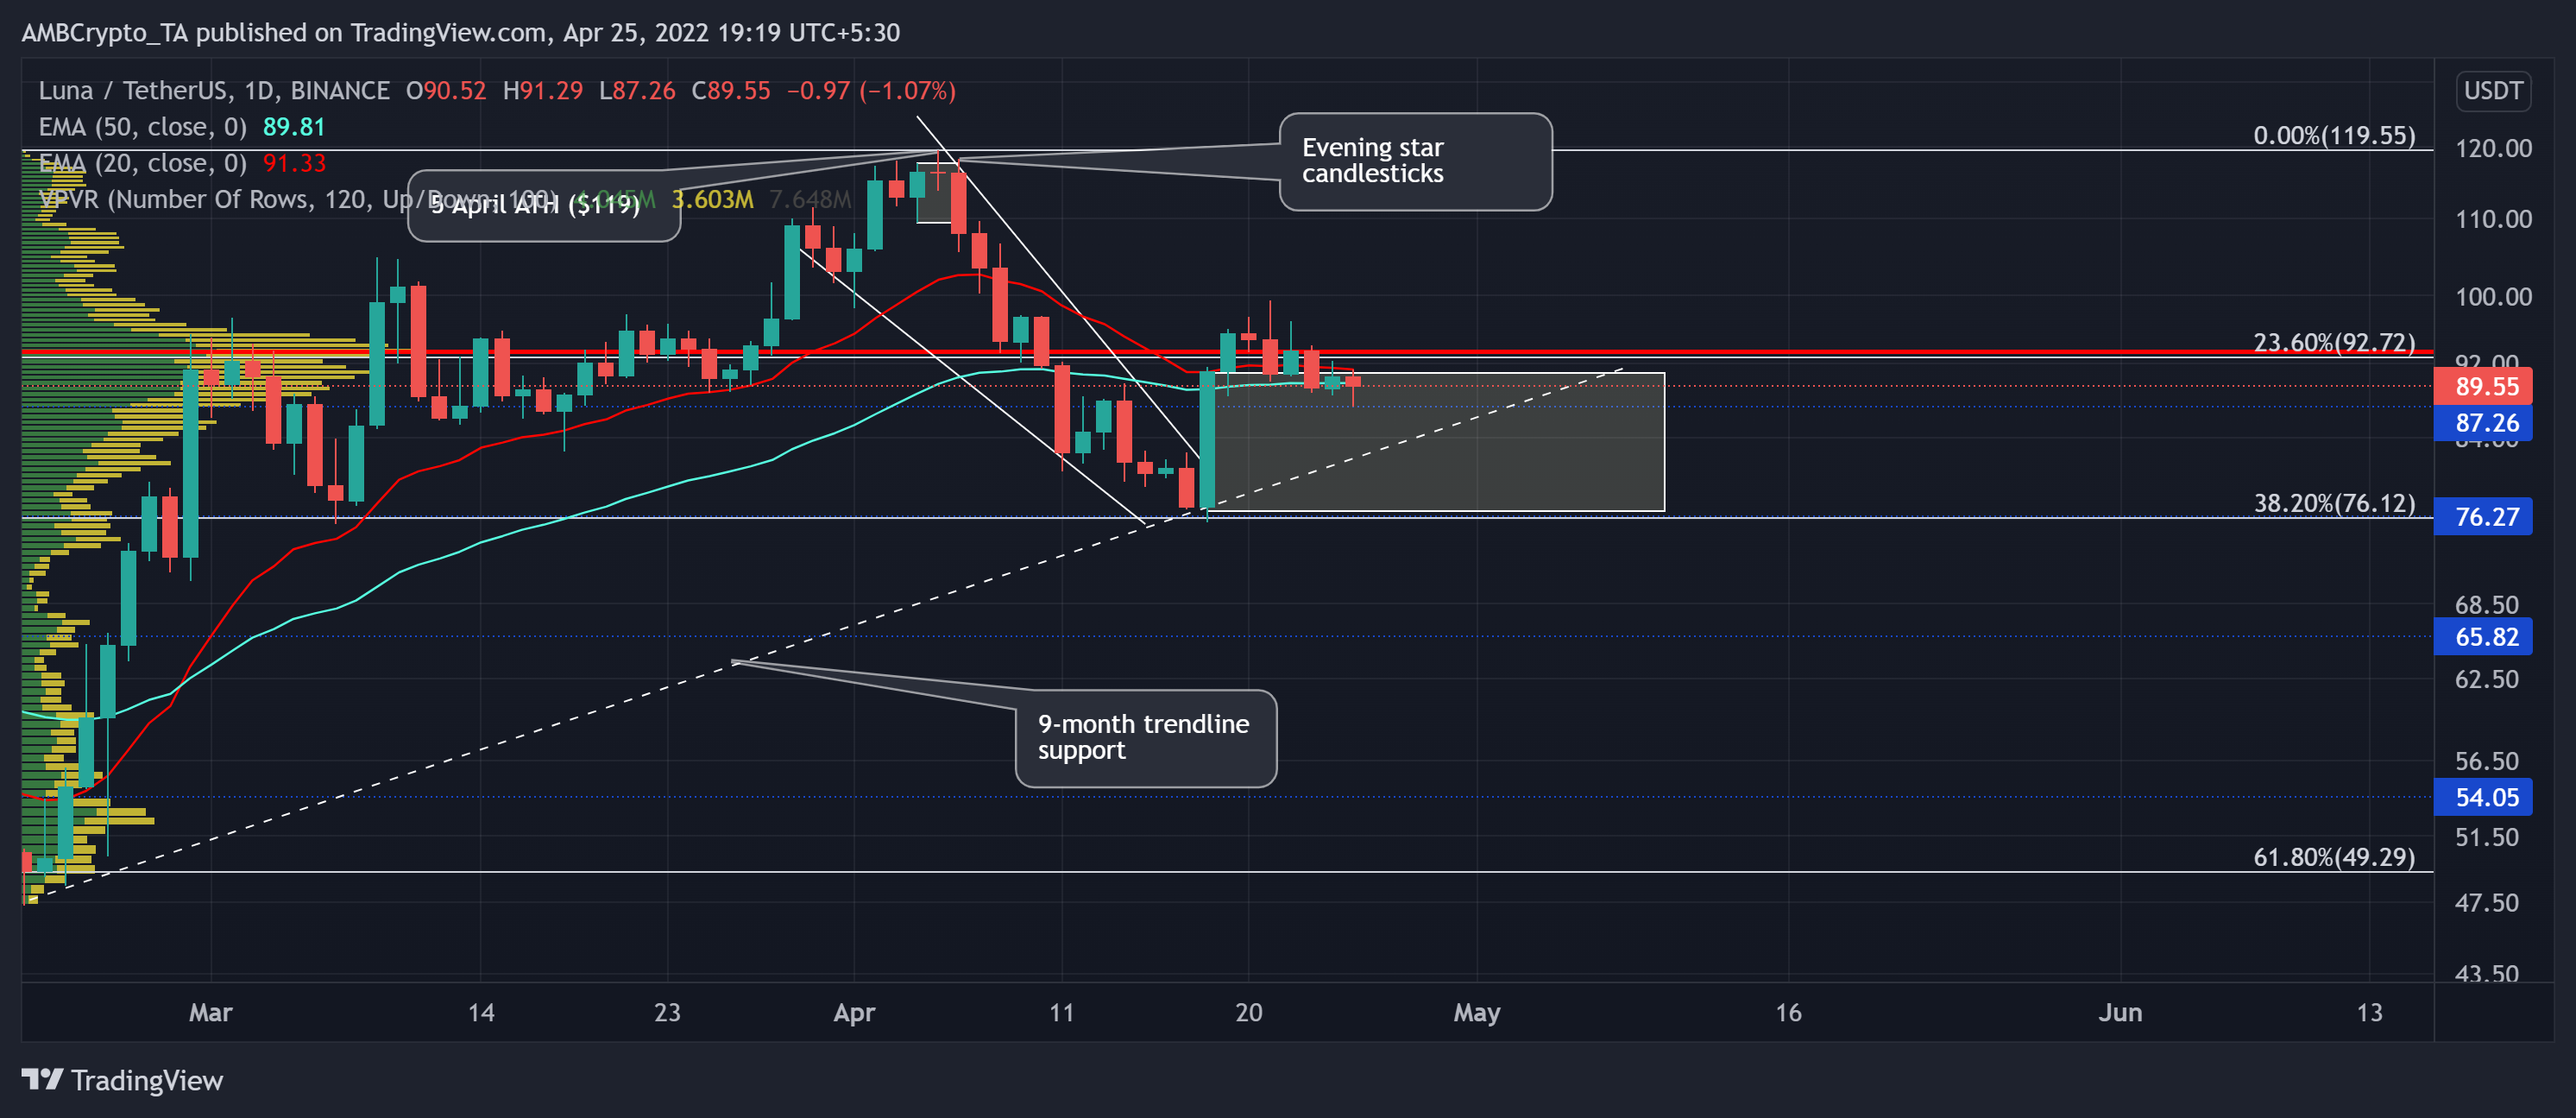
Terra (LUNA) was in a flimsy situation on its daily chart. Trading near its 20 EMA (red) 50-SMA (cyan), the altcoin wobbled below its Point of Control (POC, red).
Now, bulls needed to save LUNA at its nine-month trendline support (white, dashed) to prevent the sellers from causing further drawdowns. At press time, the alt was trading at $89.55, down by 2.27% in the last 24 hours.
LUNA Daily Chart
Source: TradingView, LUNA/USDT
LUNA’a previous rally fetched a remarkable 150% ROI after the price sprung from the 61.8% Fibonacci baseline. As a result, it touched its lifetime milestone on 5 April at the $119-mark.
Since its ATH, LUNA marked an Evening Star Candlestick pattern and tumbled below its POC zone. The POC also coincided with the 23.6% support level, thus proving to be an important area of value. Although the bulls propelled an upswing from the 38.2% level, the sellers refused to dwindle at the $92-resistance.
After the recent falling wedge breakout, LUNA saw a solid bullish engulfing candlestick that further strengthened the $87-mark support and created a strong demand zone (rectangle) in the $76-$90 range. So, a likely revival from its immediate trendline support seemed plausible while the buyers would aim to ride along with the long-term uptrend.
Should the current trendline support stand sturdy, the buyers would gather thrust to reclaim the 23.6% support while entering a likely tight phase near the POC. Should things go south, the bulls could still rely on the demand zone to support those retracements.
Rationale
Source: TradingView, LUNA/USDT
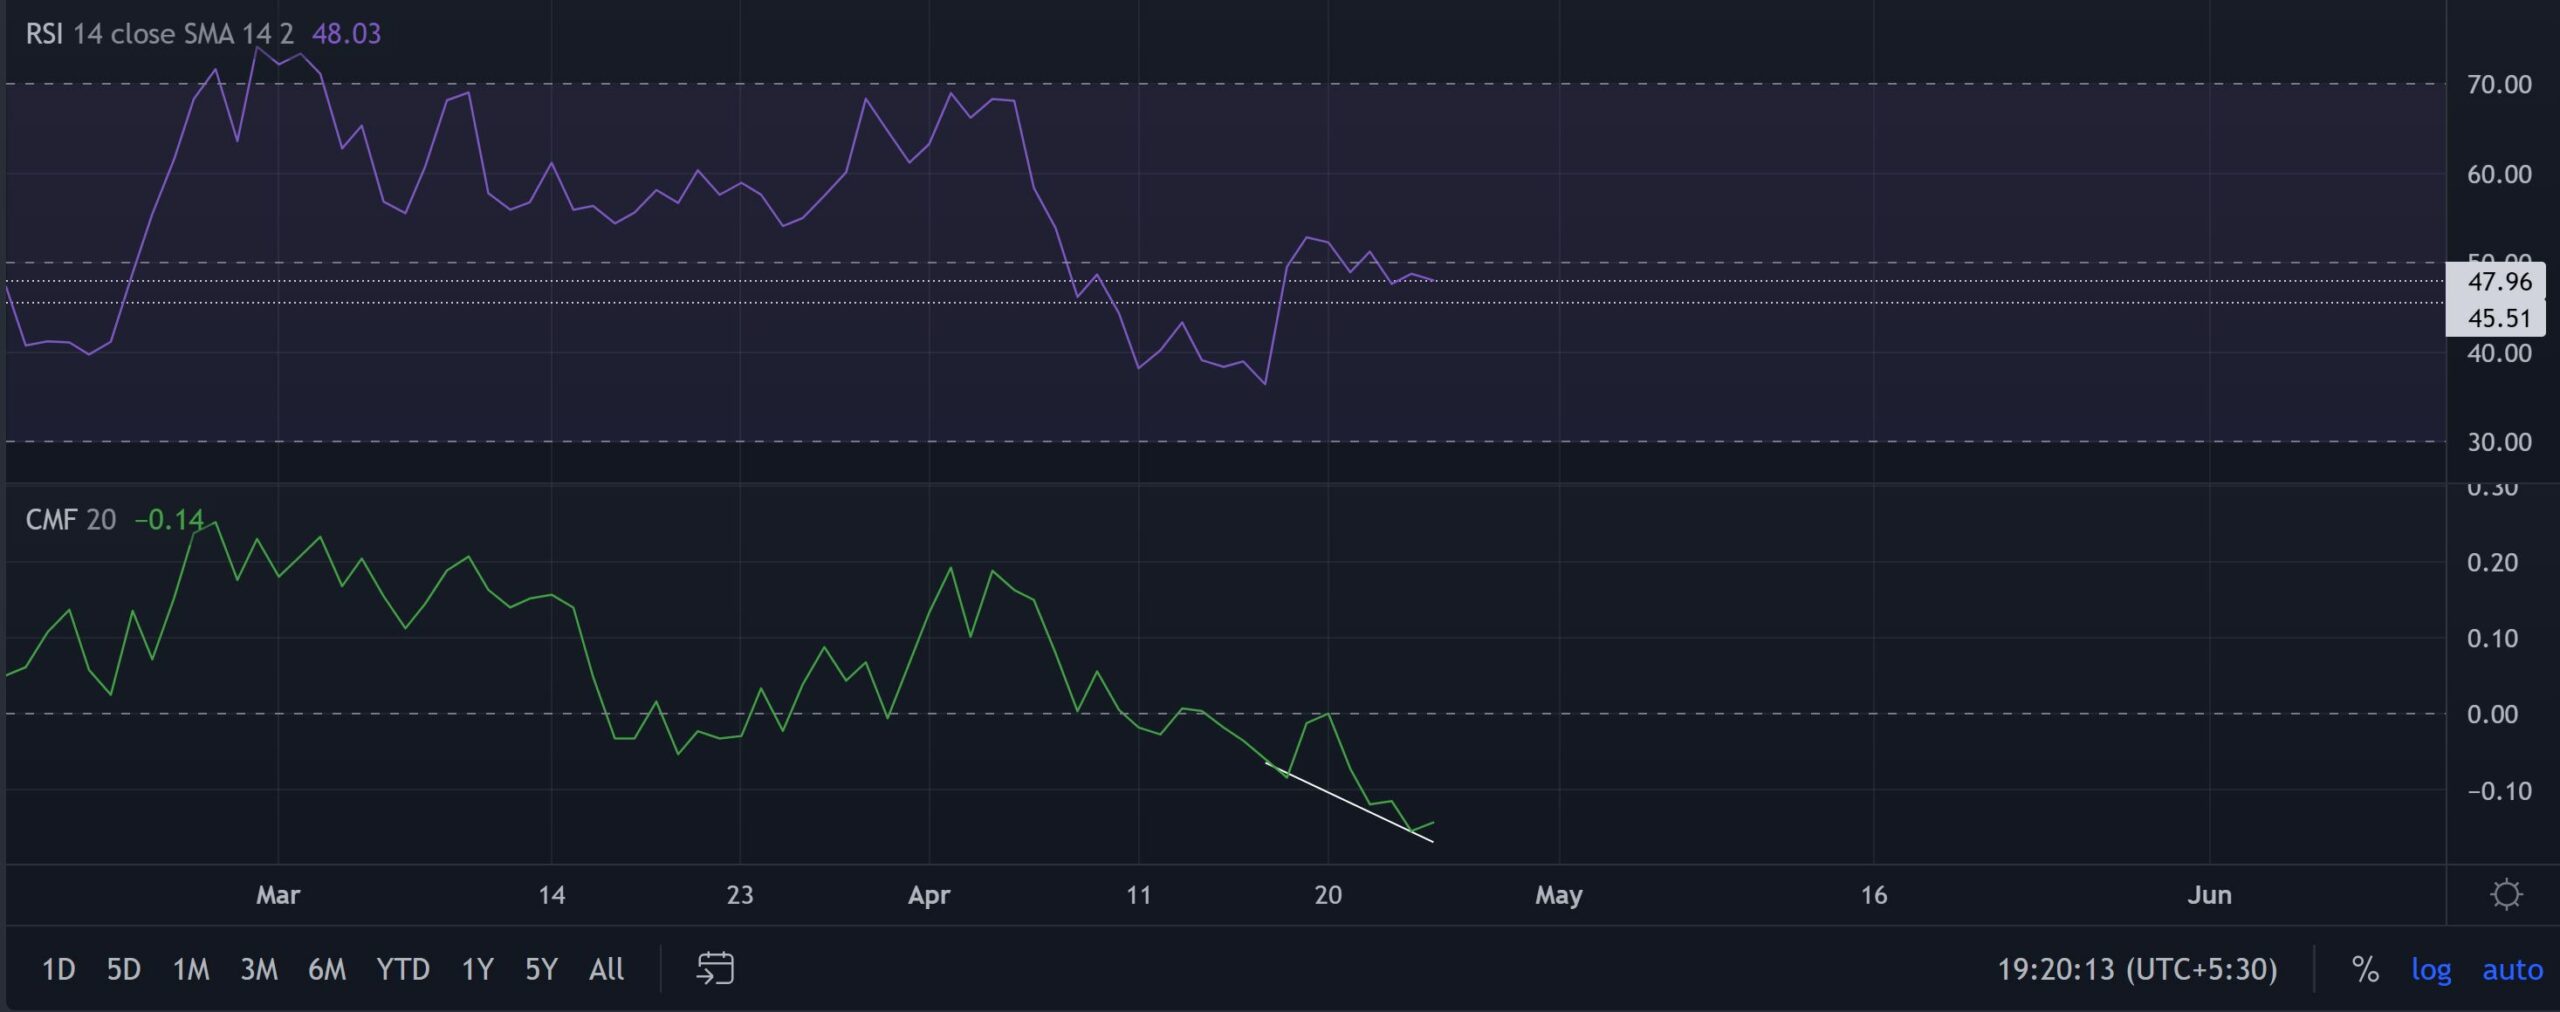
With the increased selling pressure, the bears dragged the RSI below the mid-line. If the bulls continue to find cushions at the 45-47 range, LUNA would likely find aid in the $83-$87 zone.
Furthermore, the CMF affirmed the recent sell-off situation while steeply falling below the zero-mark. But with a hidden bullish divergence with price, a near-term revival on LUNA’s charts should not be a surprise.
Conclusion
In view of the sturdiness of the nine-month trendline support and the immediate demand zone, LUNA could support further retracements in the $82-$87 zone. A revival from this mark would help buyers mount pressure to challenge the bounds of the POC and reclaim the 23.6% Fibonacci level.
Having said that, the investors/traders must keep a close watch on Bitcoin’s movement which could potentially affect the broader market sentiment.