Here’s when and why Ethereum is most likely to turn a bullish page

It is fair to say that Ethereum did not enjoy the last month of Q2 2021. The trend has looked weak from a bulls’ perspective and ETH ended up testing its recent low range of $1700-$1750. Yet, we are reaching the end of another gruesome 7-day period, and there are signs that the incoming green could be relatively positive for the largest Altcoin.
3-week and bust?
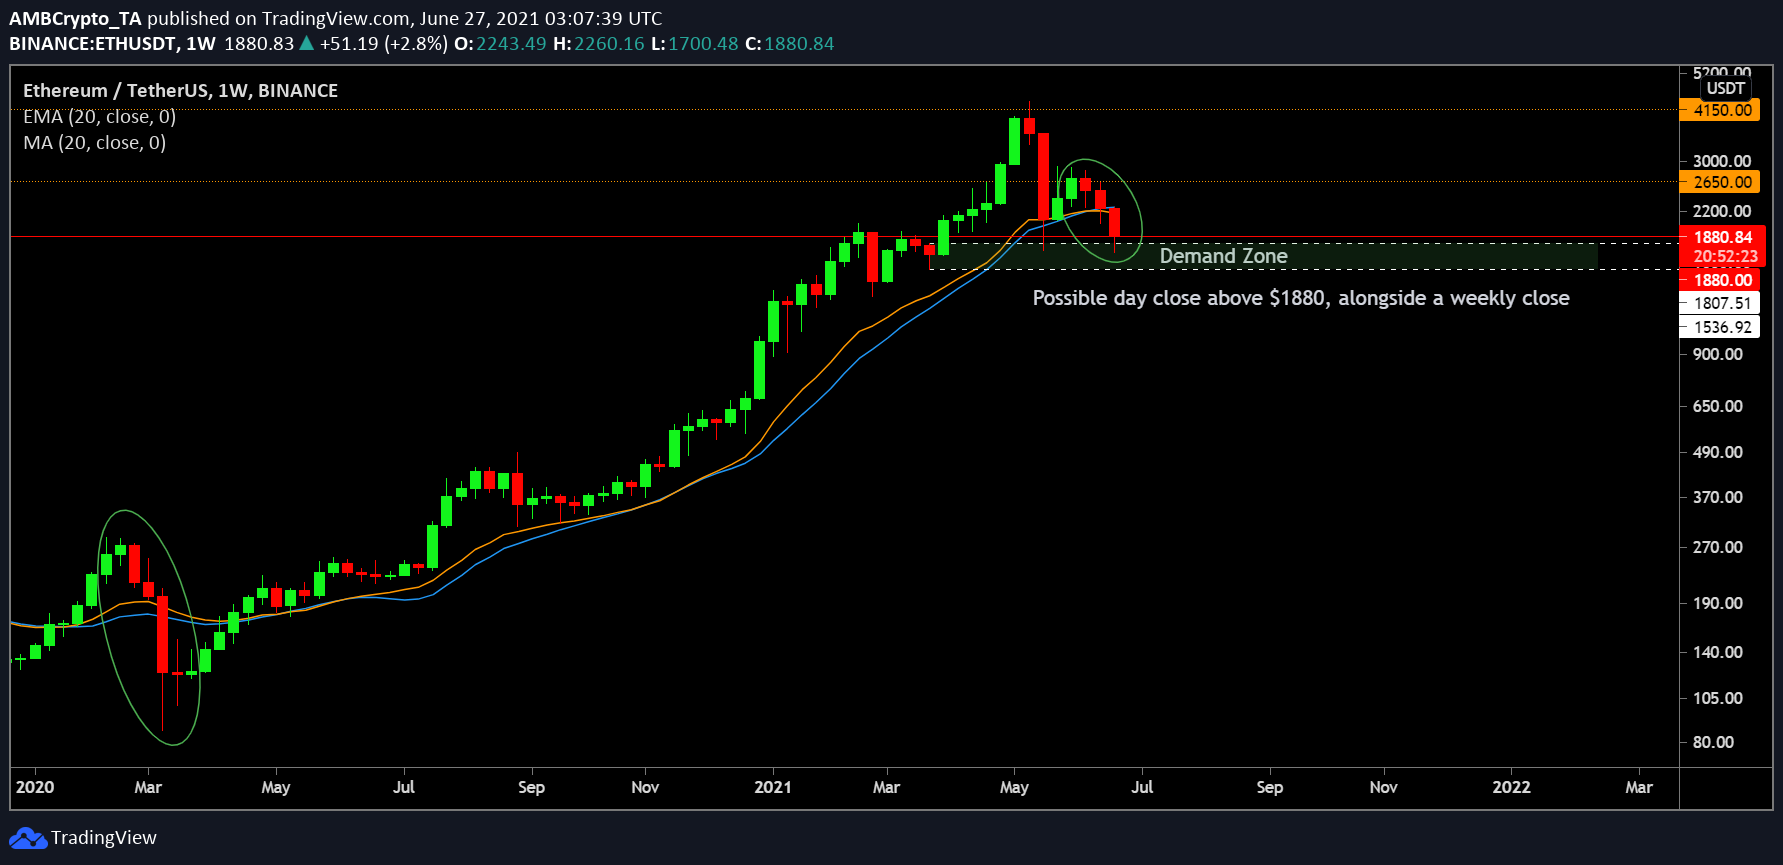
As mentioned above, Ethereum completes 3-weeks of bearish price action today. The time period is particularly important because the last time Ethereum faced just a correction of 4-straight weeks was back in March 2020, during the black swan crash. The odds are definitely in favor of ether to register a green-candle week.
Another key observation is that Ethereum is currently retracing from its demand zone and the asset will possibly close both the weekly and daily candle above the critical support of $1880. Ethereum has only recorded a daily close under $1880 over the past 2 days even though, the asset had tested $1720, and $1700 previously in the charts.
Selling pressure losing steam?

Rising pressure has been one of the key factors for ETH’s dump as short-term traders exited the market. Massive Inflows have already been recorded but since 24 May, outflows have gradually improved. On 25th June, 117K ETH exited Centralized and Decentralized exchanges, which is suggestive that selling pressure is finally tapering off. At press time, 13.8k ETH inflows were observed, but inflows are relatively smaller at the moment.
Will Relative Unrealized Profit trigger the rally for Ethereum?

While it is difficult to assume that historical price action is repetitive, unrealized profit could be based on how traders react to declines. At press time, relative unrealized profits for Ethereum had a sharp similarity with the price action of June-July 2017. The trajectory appeared downwards as well before the price picked up a bullish gear in the 2nd half of 2017.
Unrealized Profits are strongly dependent on hodlers, and since it is still maintaining a higher range, the strength of long-term holders is sound. Markets have recovered from such instances in the past, so likelihood of a strong recovery next week can be expected.
Hand in Hand with Bitcoin?
Bitcoin has managed to move above $33,000 yet again, and similar to Ethereum, it re-tested its demand zone over the past week. Now, according to data, the number of active addresses has spiked over the past few hours for Bitcoin, displaying strength in the ongoing recovery from an on-chain perspective.
During bearish cycles, recovery is mostly collective, and Ethereum will only benefit from BTC scaling up in the charts, as we enter the 2nd half of 2021.