Polkadot, Uniswap and Bitcoin Cash Price Analysis: June 27

The global crypto market cap was $1.36 Trillion, which registered a 2% increase over the last 24 hours. Most altcoins noted some recovery, for instance, Bitcoin Cash witnessed a 2.7% increase in prices over the last day, UNI’s market capitalization increased by 10.27% and finally, DOT pictured a bullish crossover on the 4-hour trading chart at press time.
Polkadot (DOT)
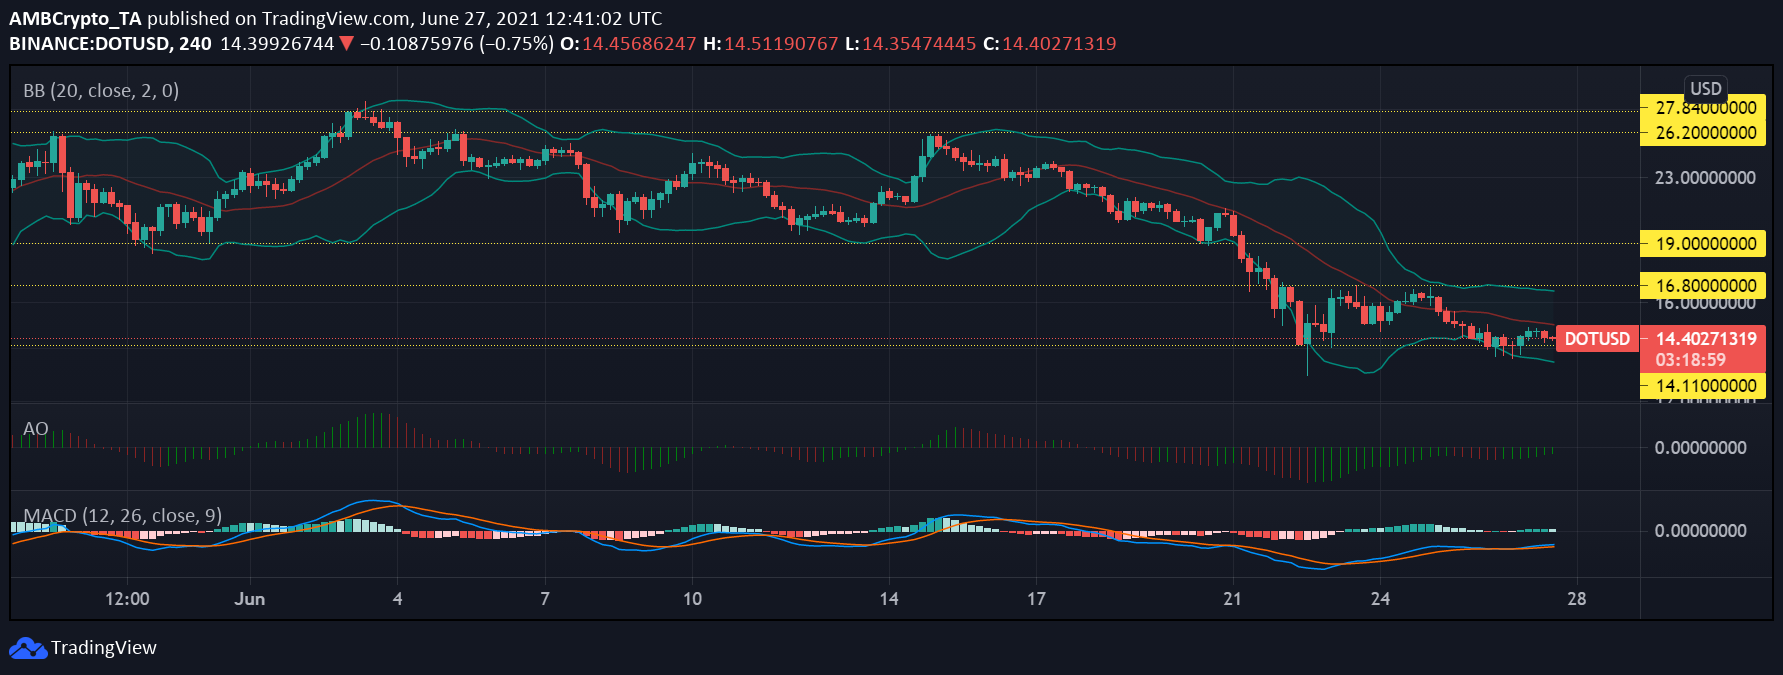
After testing its crucial support level of $16.80, the coin dipped to a low of $14.09, and has been trading between its immediate resistance and support level. At the time of writing DOT was trading in the red at $14.67.
With a further hike in prices, it could face resistance at $16.80 again. Bollinger Bands remained parallel at press time which meant that the prices won’t be subjected to heavy volatility.
MACD histograms pictured a bullish crossover on June 26 and at the time of writing, the alt moved on bullish momentum. Similarly, on the Awesome Oscillator indicator, the coin marked the onset of a bullish signal on June 26 which remained the same at press time.
Uniswap
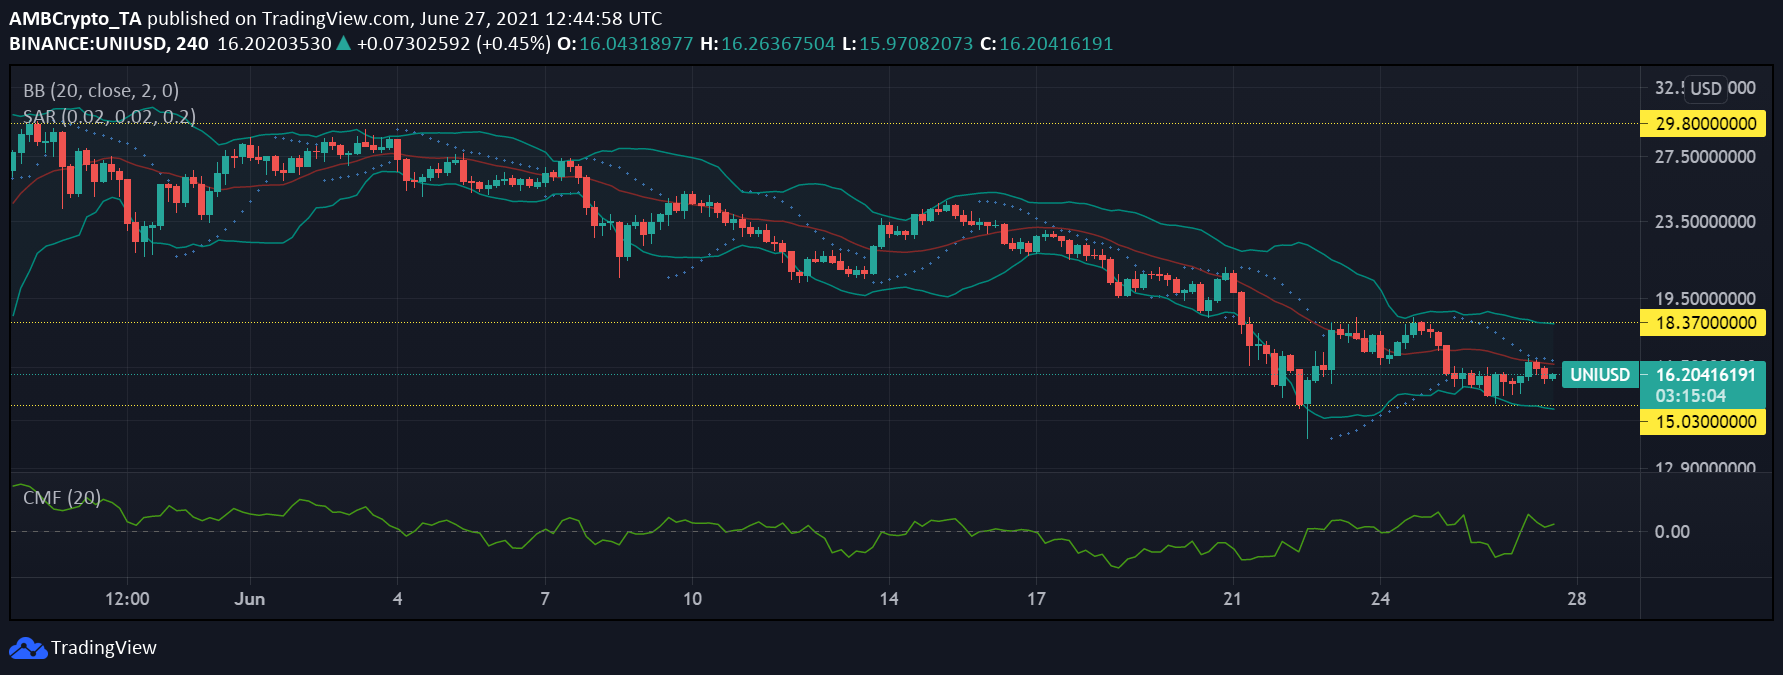
UNI witnessed price corrections for a few days after which it again dipped. At press time, the coin was trading at $16.41 and it had seen a 2.6% increase in prices over the last 24 hours. The alt had fallen by 17.6% over the last week.
Bollinger Bands projected reduced price volatility as suggested by the parallel movement of the bands at the time of writing. Chaikin Money Flow pictured a tiny uptick which signified that capital inflows have grown slightly as compared to capital outflows.
With restricted price movement and the coin not recovering substantially, Parabolic SAR at the time of writing displayed a continued downtrend as the dotted lines stayed above the candlesticks since June 25.
Bitcoin Cash
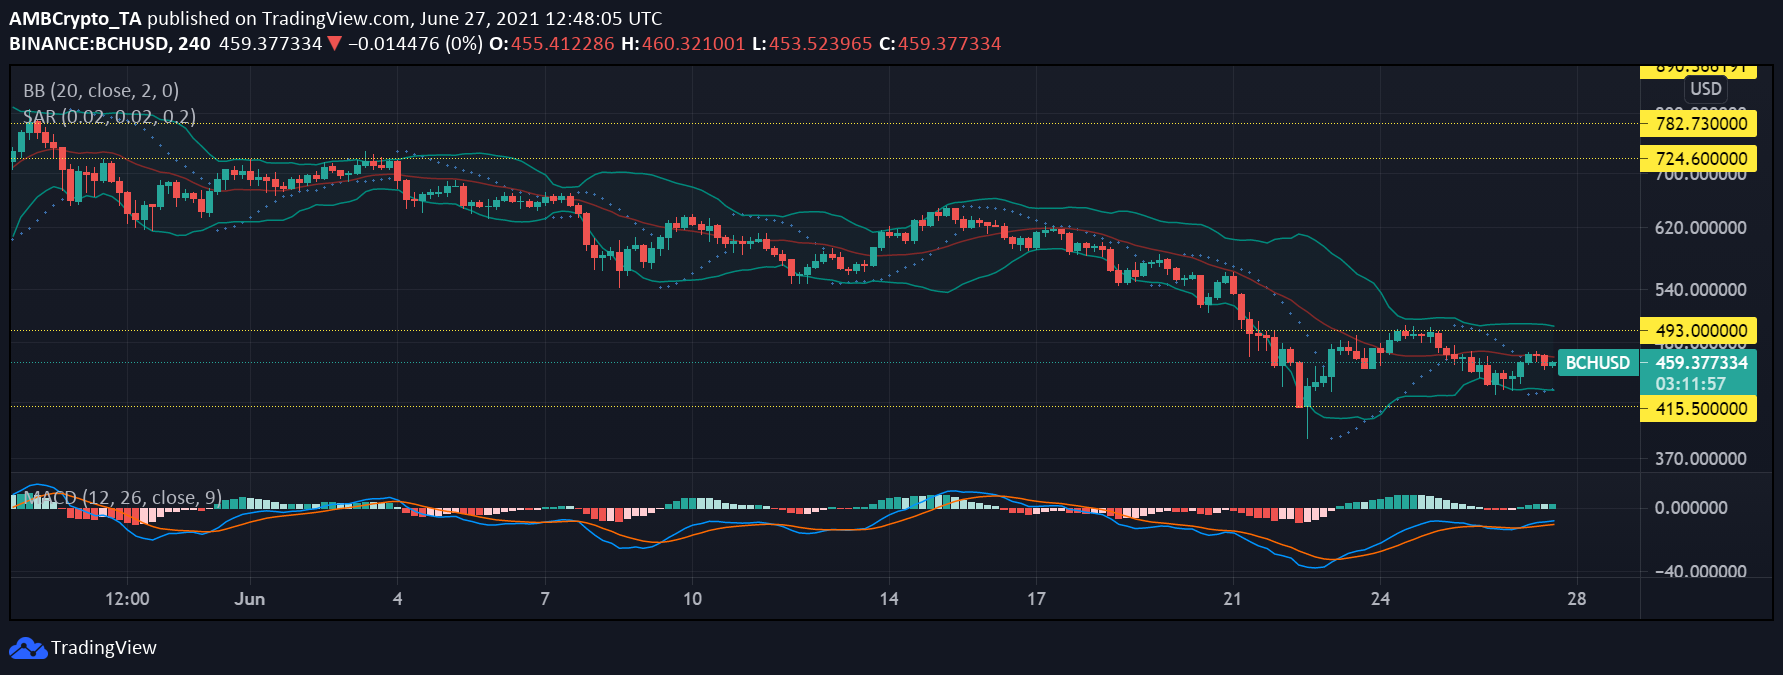
BCH observed a 16.7% decline in prices over the last week. BCH was trading in green and was trading at $459.37.
With the coin moving between its immediate support and resistance levels, a further increase in prices could mean that BCH would test its resistance level. If the coin fell further, the next support level would be at $514.50.
Bollinger Bands remained parallel and showed no further divergence at press time, this signaled low price volatility. Parabolic SAR’s dotted lines hovered below the candlesticks which pointed towards an uptrend at the time of writing.
MACD histograms depicted on the 4-hour trading chart a bullish crossover on June 27 and an onset of bullish momentum.


