Bitcoin

Here’s why Bitcoin [BTC]’s September gains may be nothing more than a façade
Posted:
editors

The end of August went rough on Bitcoin [BTC] as its price plunged. However, September has bought some better days as the crypto registered only a slight decline in its seven-day performance.
This may be considered as a sign of an uptick in the near future. At the time of writing, BTC was trading just below the $20,000 mark at $19,950.41 with a market capitalization of $381,836,195,229.
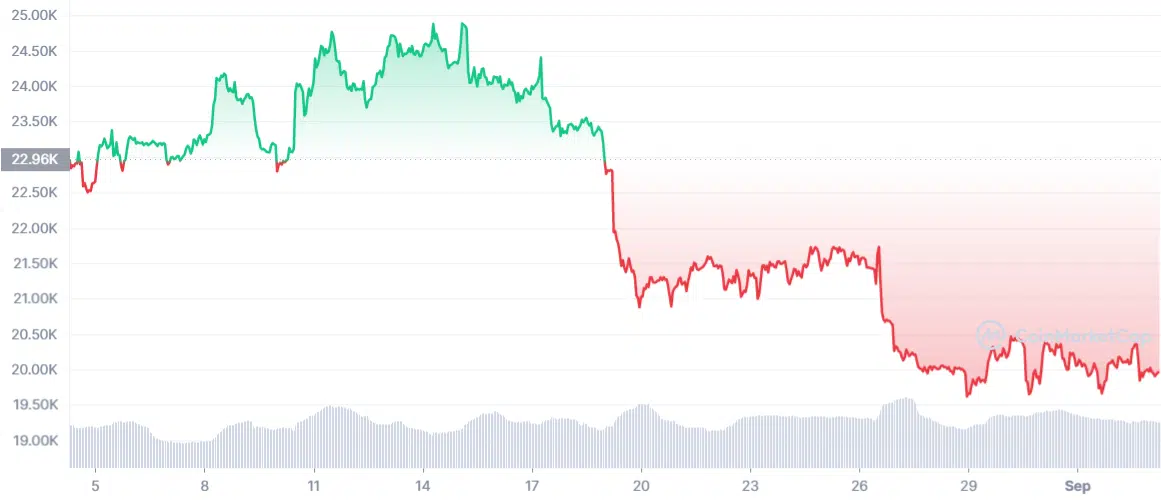
Source: CoinMarketCap
Though BTC’s one-month chart was mostly painted red, Glassnode’s investors’ confidence in the coin didn’t seem to decrease. This too can be considered as a positive for the coin.
With so many events happening, how soon can we expect the bulls to buckle up and drive BTC’s next upward rally?
What to expect?
Recently, the number of addresses holding 1+ bitcoins just reached an ATH of 900,232, indicating that investors are expecting a price surge in the coming days.
? #Bitcoin $BTC Number of Addresses Holding 1+ Coins just reached an ATH of 900,232
Previous ATH of 900,198 was observed on 01 September 2022
View metric:https://t.co/s7tx1xxyz3 pic.twitter.com/uQBq8ygpyA
— glassnode alerts (@glassnodealerts) September 3, 2022
While the opinions are diverse, several analysts spoke about their assessment of the situation. For instance, TAnalyst, a popular Twitter handle, recently posted a chart that showed something interesting.
Additionally, as per the chart, a bullish wedge pattern was formed, which indicated the possibility of Bitcoin’s next bull-rally in the days to come.
#BITCOIN IS READY FOR A MASSIVE BULL RUN.
A one-year falling wedge implies a strong succeeding uptrend. pic.twitter.com/Jo4YmmykdZ
— TAnalyst (@AurelienOhayon) September 2, 2022
Bitcoin’s total exchange outflow also supported TAnalyst’s findings, and the figure went up slightly, which is a bullish signal.
Source: Glassnode
Moreover, Bitcoin’s risk reserve ratio also fell considerably. This might indicate a market bottom along with creating an opportunity for investors to accumulate as the risk to reward ratio increased.
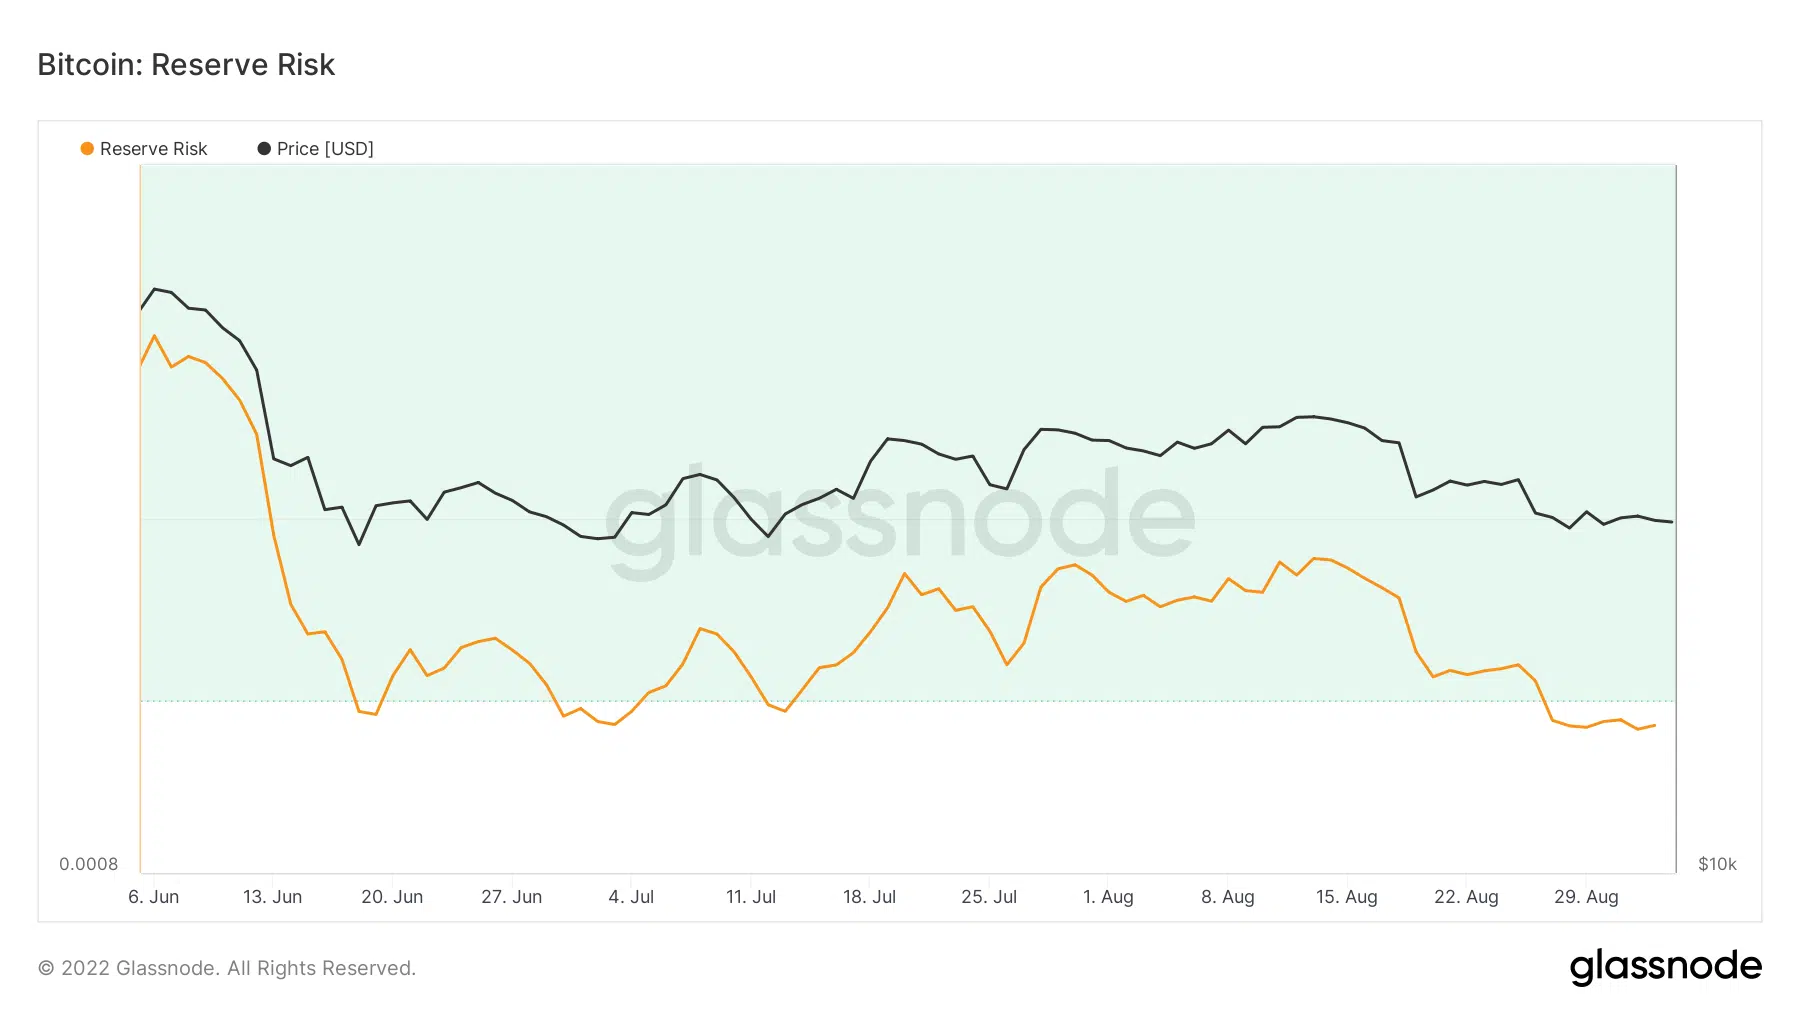
Source: Glassnode
However, on the other hand, some analysts state otherwise. In his assessment, Maartunn, an analyst and author at CryptoQuant, pointed out in his assessment that the bears might still have an advantage in the market.
According to the data present, an episode of miners moving Bitcoins to exchanges was followed by a price plunge, as a similar trend was seen in May and June.
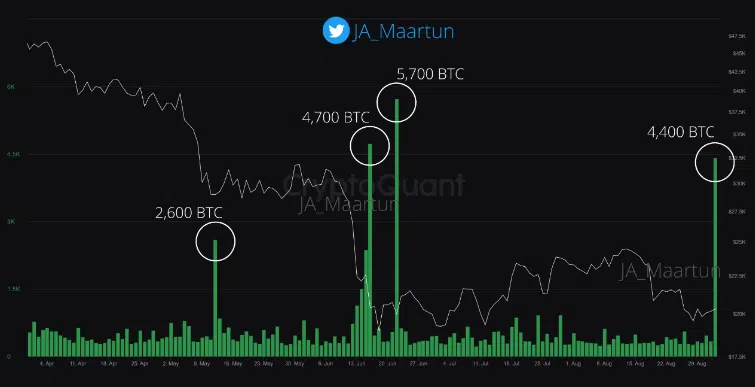
Source: CryptoQuant
Furthermore, as 4,400 BTC were transferred recently on 2 September from miners to exchanges, history might repeat itself. There stands a chance of the BTC price plummeting over the coming days.
Going forward
BTC’s four-hour chart painted a vague picture of its price action as many indicators showed diverse readings. The EMA Ribbon indicated a possible bull-run as the gap between the 20-day and 55-day EMA was reduced, creating an opportunity for a bullish crossover. Moreover, an ascending triangle formed, which further increased the chances of an uptick.
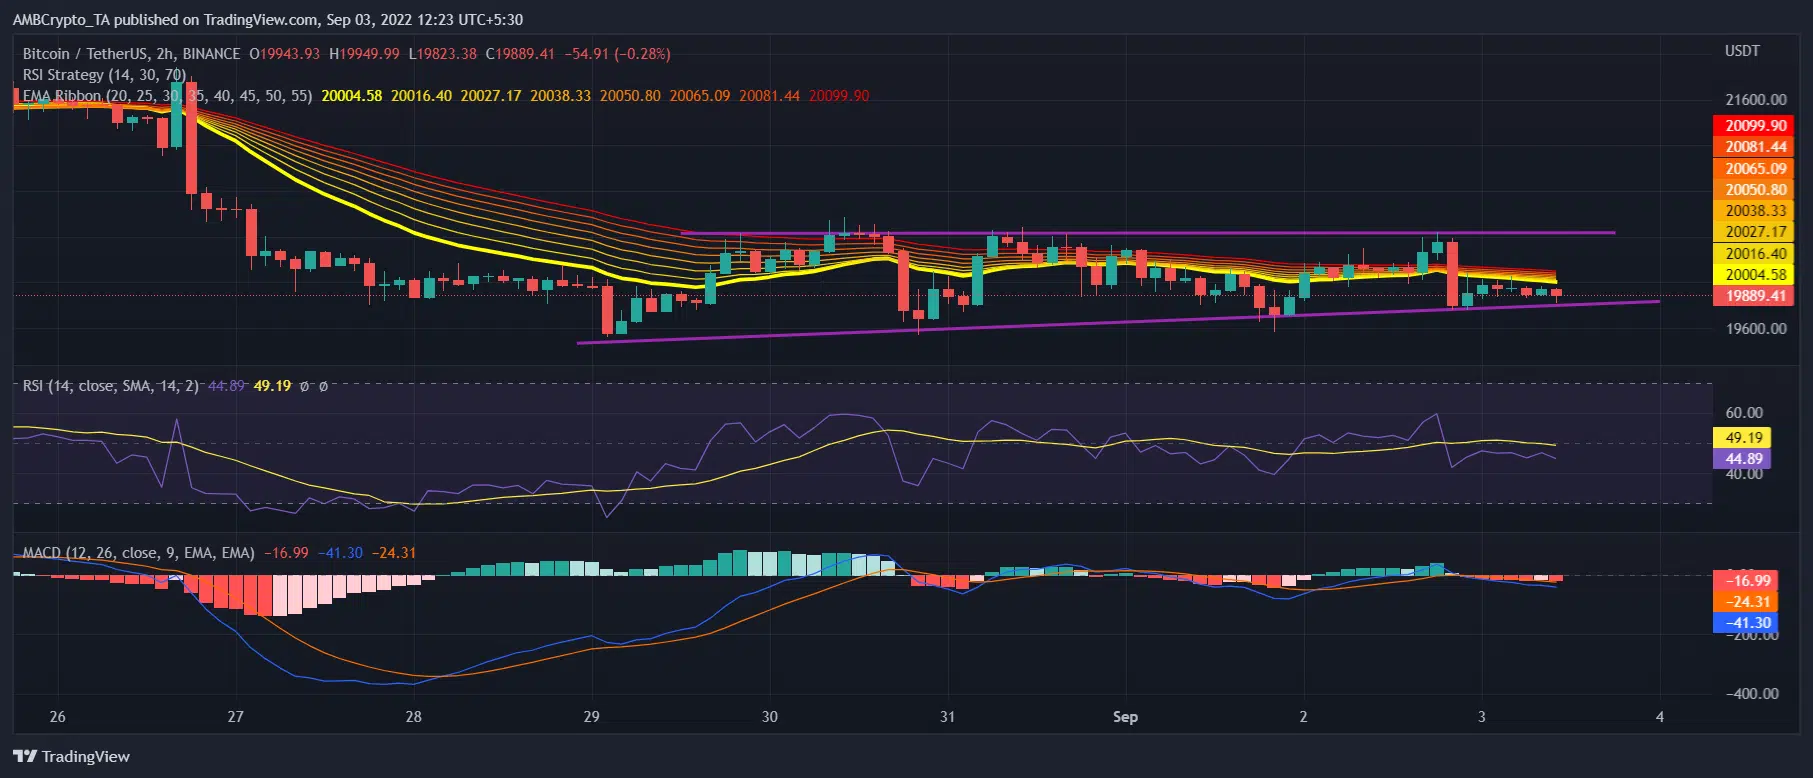
Source: TradingView
However, the Relative Strength Index (RSI) and Moving Average Convergence Divergence (MACD) told a different story. The former registered a downtrend and the latter displayed a bearish crossover. This minimizes the chances of the northbound breakout in the short-term.