Here’s why BNB investors could have to wait for their fortunes to flash green

- BNB’s RSI was in an overbought position
- MVRV Ratio up, suggesting a possible market top, but other market indicators were bullish.
Like most other cryptos, Binance Coin [BNB] entered the first week of this year with joy after increasing its value. CoinMarketCap’s data revealed that BNB’s price went up by 11% in the last seven days, and at press time, it was trading at $275.62 with a market capitalization of more than $44 billion.
Read Binance Coin’s [BNB] Price Prediction 2023-24
Nonetheless, investors must be cautious as things might take a U-turn soon, as a few on-chain metrics looked bearish for BNB.
What concerns do investors have?
CryptoQuant’s data revealed that BNB’s Relative Strength Index (RSI) was in an overbought position, which was a massive bearish indicator suggesting a trend reversal in the coming days. In fact, the price decline might have begun already, as at the time of writing, BNB’s price had declined by over 1.3% in the last 24 hours.
Despite the possibility of a trend reversal, BNB remained popular in the crypto space, as it was on LunarCrush’s list of the top five cryptocurrencies by social contributors on 10 January.
Just in! Top 5 cryptocurrencies by social contributors on #LunarCrush.$sol 10,677$eth 10,387$btc 9,526$bonk 3,807$bnb 3,309https://t.co/bqwZ1eqAHZ
— LunarCrush_Devs (@LunarCrushDevs) January 10, 2023
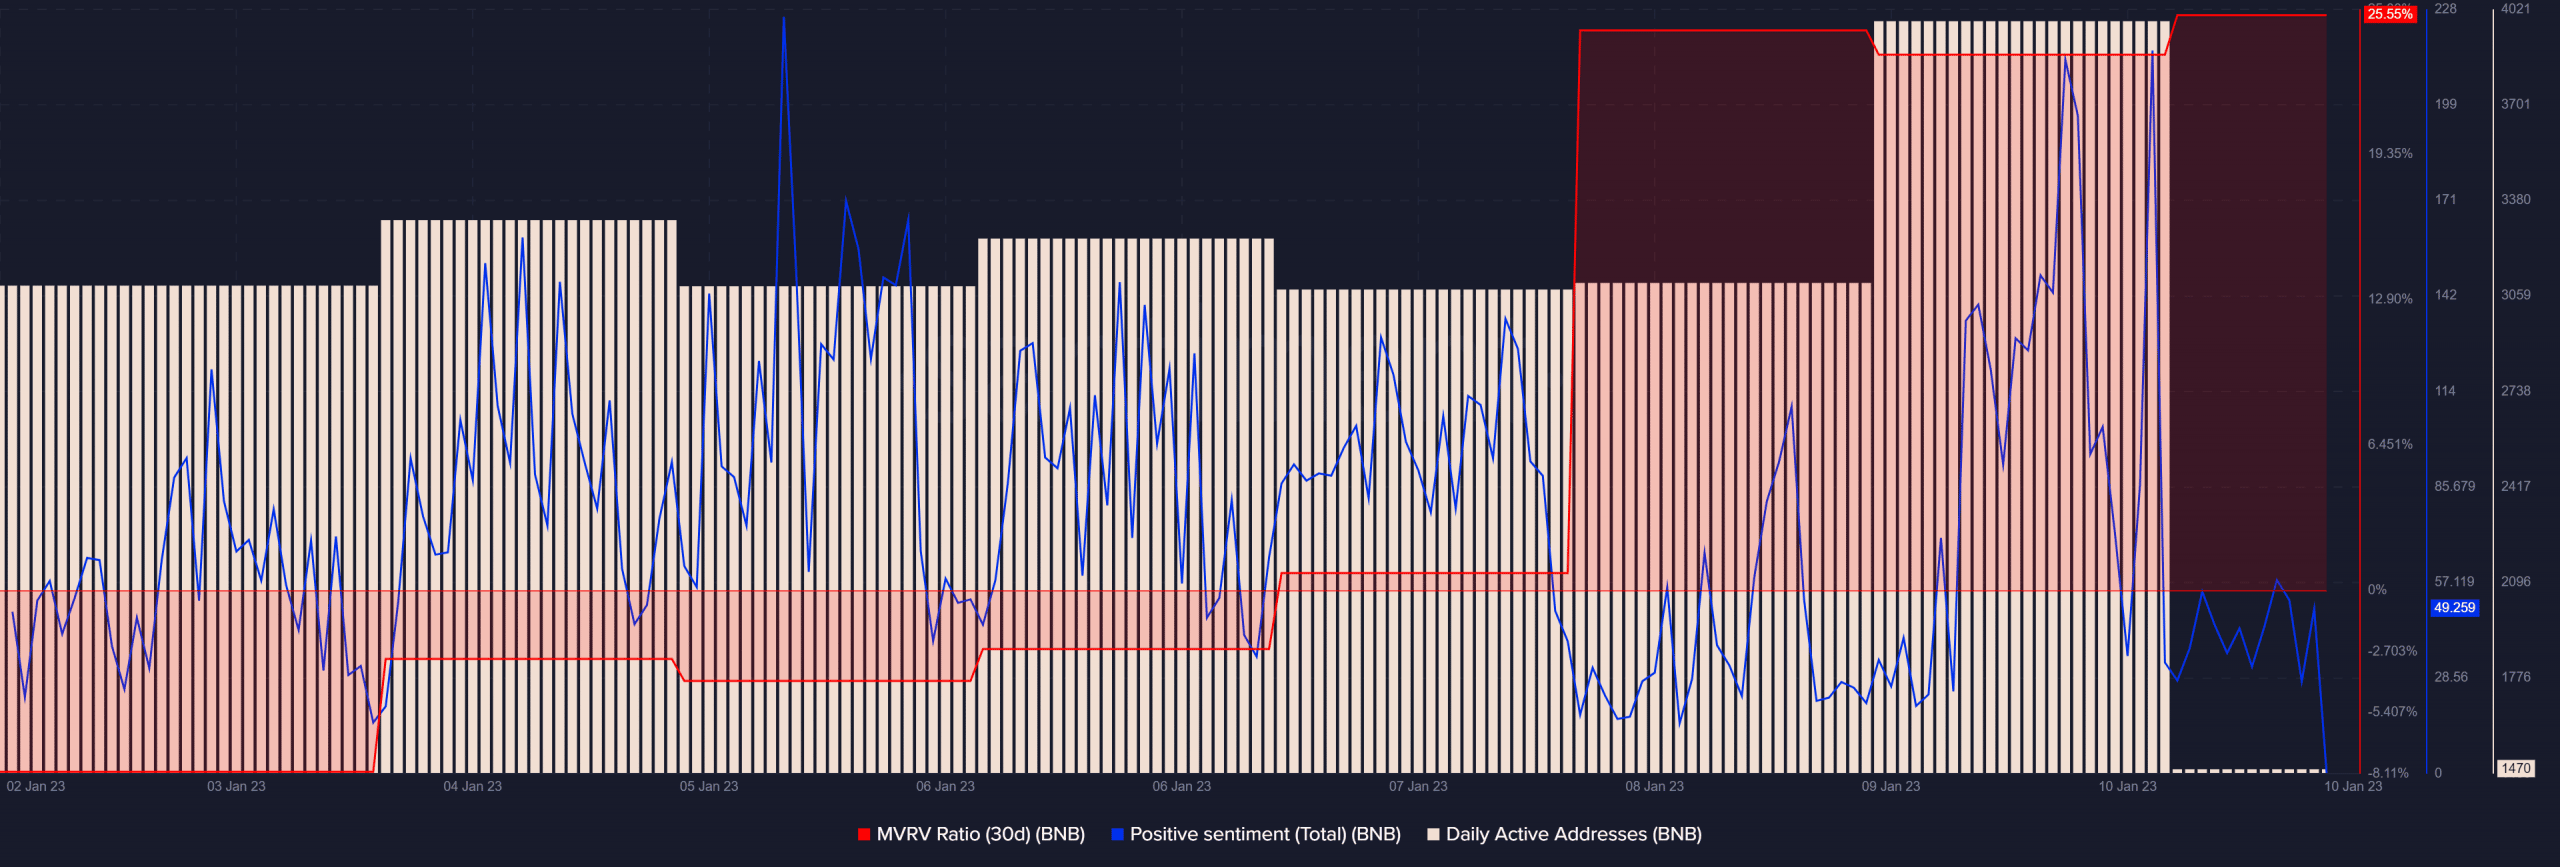
Santiment’s chart also pointed out a few concerning metrics, which further increased the chances of a price decline. For instance, BNB’s MVRV ratio was up considerably, indicating a possible market top.
Nonetheless, despite the negative metrics, positive sentiments around BNB seemed to remain unaffected. The daily active addresses on BNB also registered a slight uptick, which was positive.
Are your BNB holdings flashing green? Check the Profit Calculator
Why BNB still might have a chance
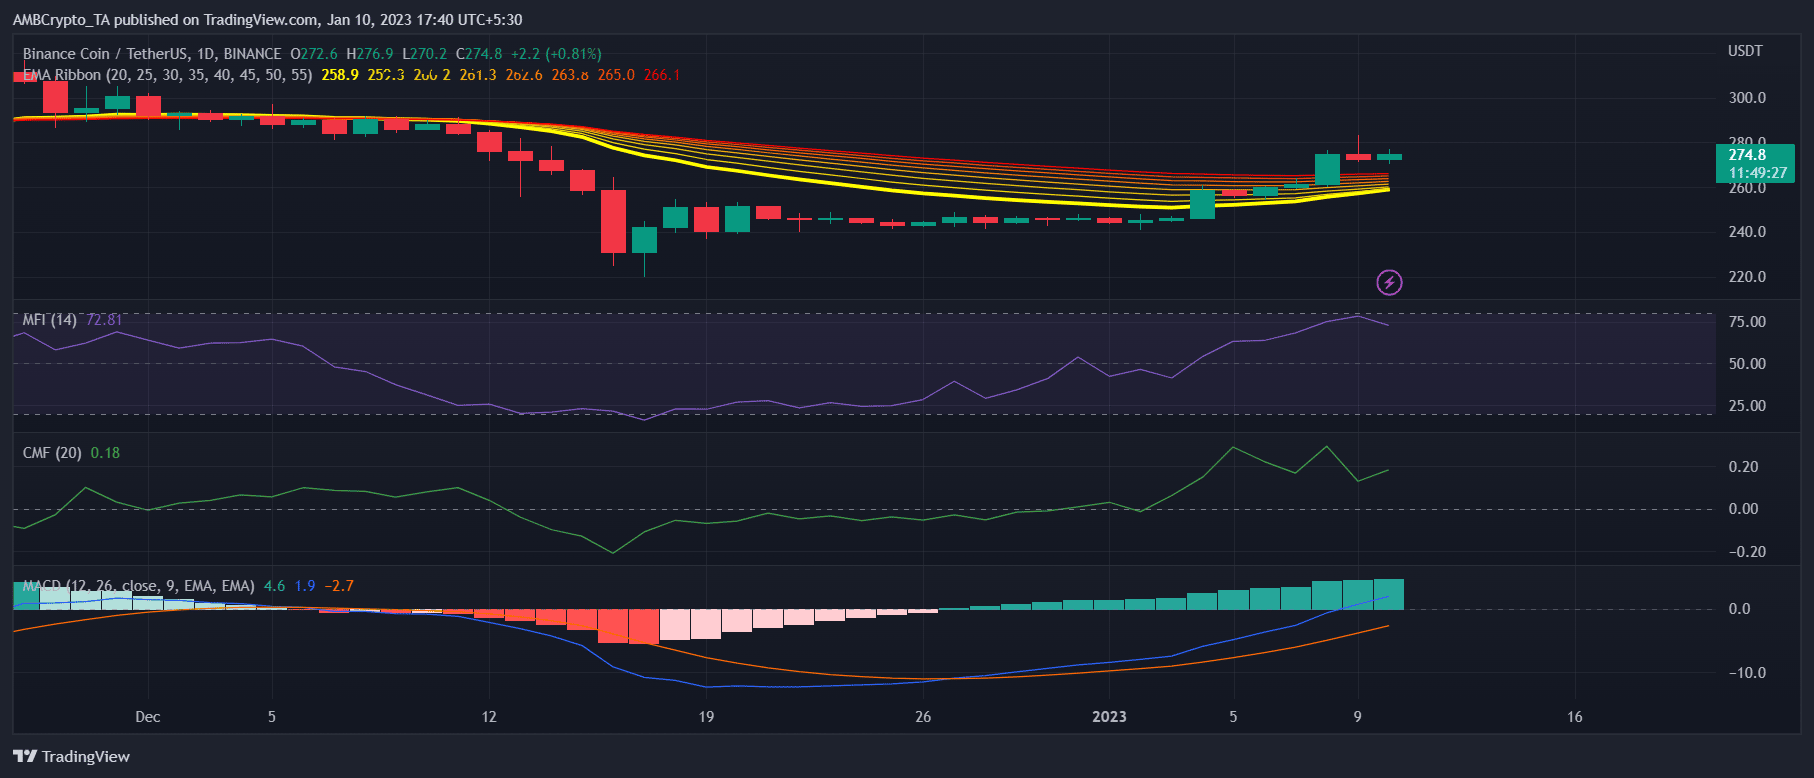
Unlike on-chain metrics, most market indicators were in favor of the buyers, suggesting a continued price surge. The MACD revealed a bullish advantage in the market. According to the Exponential Moving Average (EMA) Ribbon, the 20-day EMA was fast approaching the 55-day EMA, increasing the chances of a bullish crossover.
After a short decline, BNB’s Chaikin Money Flow (CMF) also registered an uptick. However, the Money Flow Index (MFI) was bearish as it went down and was heading towards the neutral mark.