Here’s why Solana’s downtrend is going to be difficult to reverse

Disclaimer: The findings of the following analysis are the sole opinions of the writer and should not be considered investment advice
Bitcoin has been in a consolidation phase in the past month two months, as the price faced stiff resistance in the $45k area. At the same time, Bitcoin has registered higher lows on the daily chart. Solana is an asset whose price movement could be affected by the direction of Bitcoin in the weeks to come. The market structure for Solana has been bearish since early November, with a brief rally in early February.
SOL- 1D
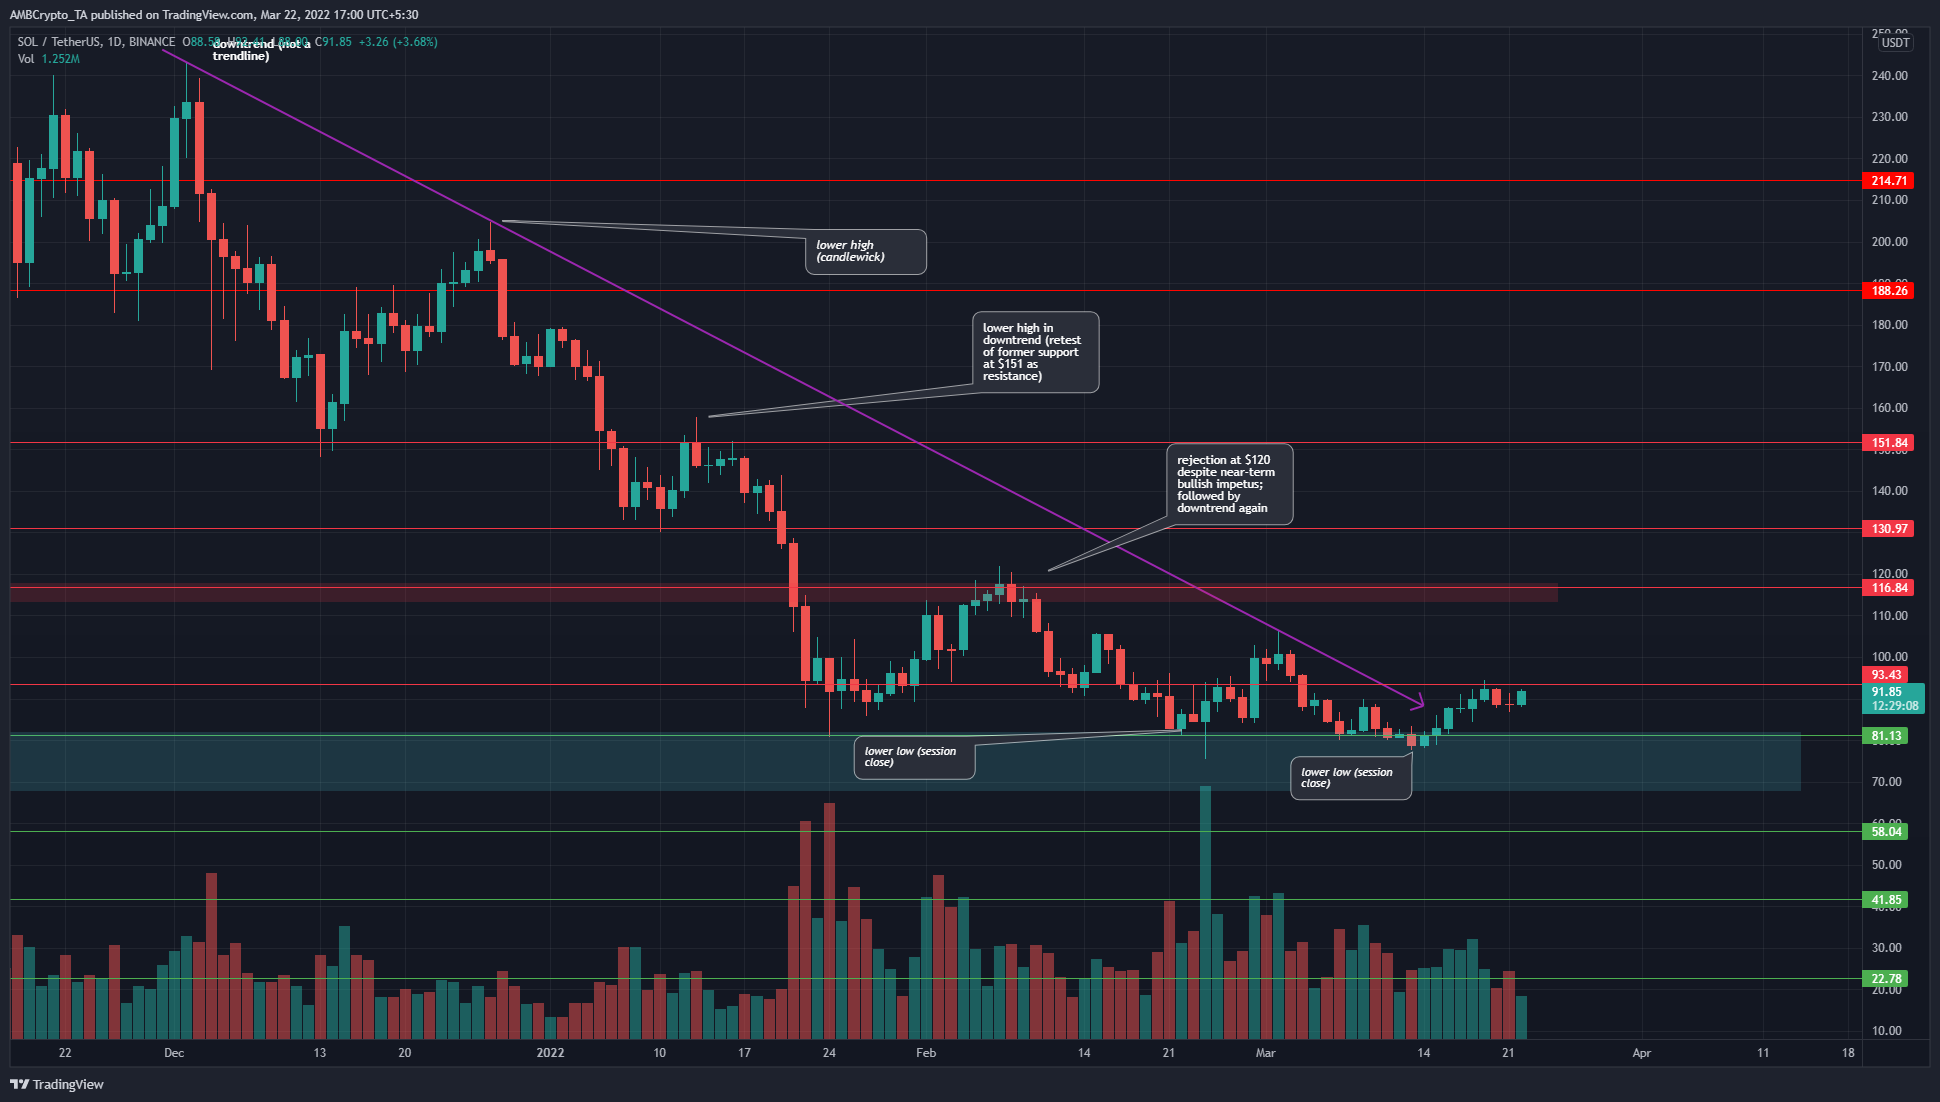
The market structure was bearish because of the series of lower highs the price has set on the charts in recent months. At the same time, the price has also set lower lows, and for this, the close of the daily candle was considered.
This is because, in a downtrend, the price can bounce and reach toward the upside in search of liquidity, but quickly find itself forced lower. Hence, candlewicks are considered. The $67-$81 area (cyan box) had acted as a good demand zone in August, as well as in recent months. But the bulls could get exhausted if the price keeps testing the same area repeatedly.
To the upside, the $106 level and the $115 area could offer significant resistance to the price.
Rationale
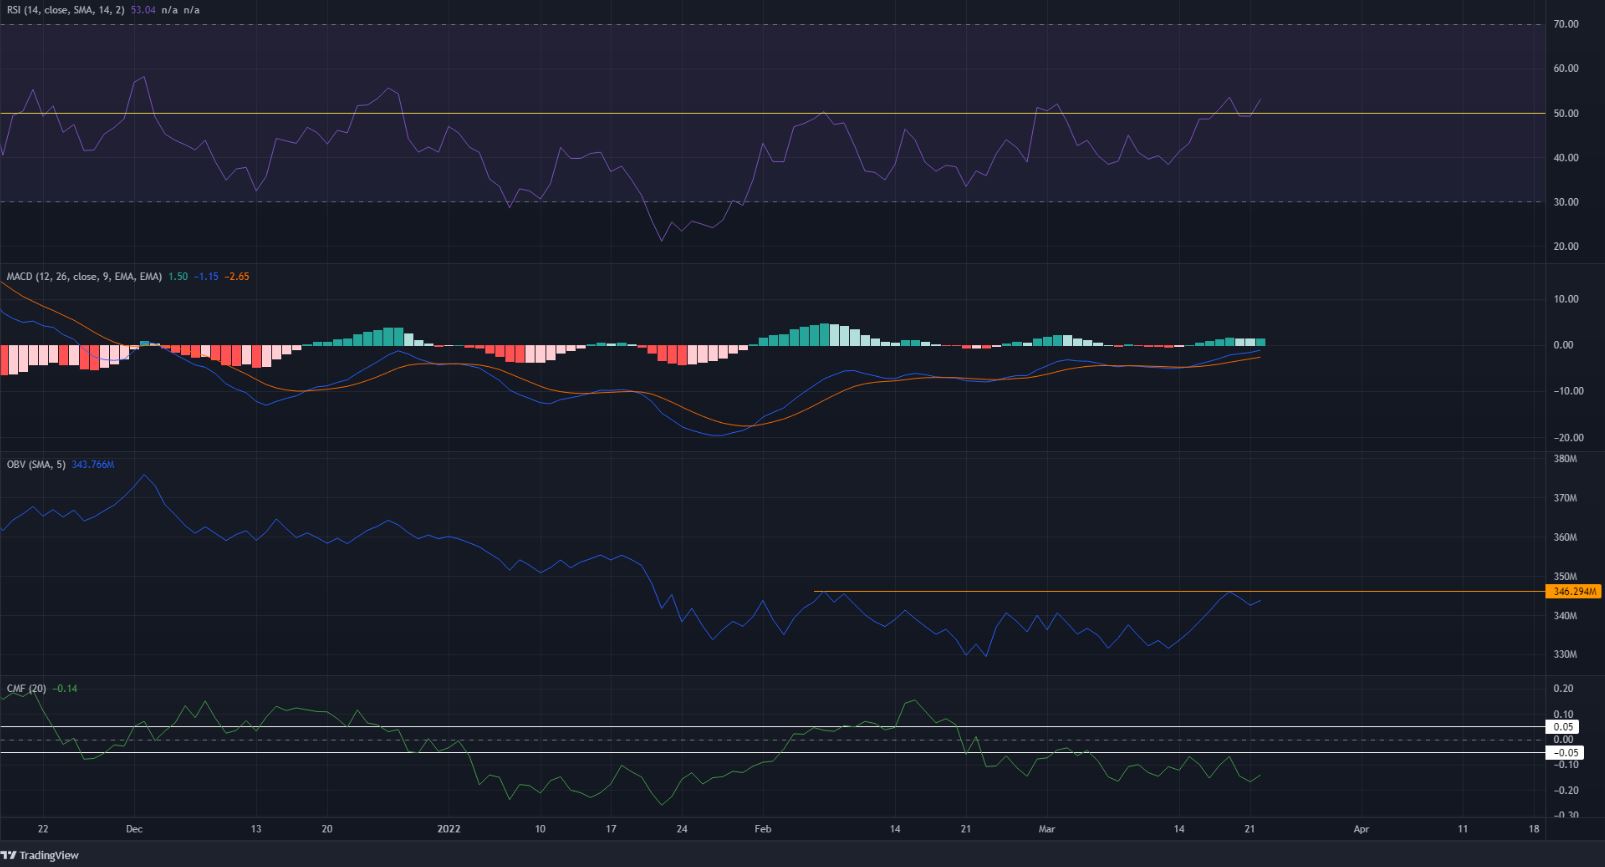
The RSI hauled itself above neutral 50 and retested it as support in the past couple of weeks, something it has not been able to do since mid-December. Even in December, the price was quick to slump- hence, if the RSI could stay above 50 for a few more days, bulls could take it as a positive sign.
The MACD labored under the zero line, although it did form a bullish crossover and snake higher.
The OBV showed that buying volume was unable to break past the February highs, so a move past the orange level could signify that buying volume was finally beginning to occupy the driver’s seat. On the other hand, the CMF showed that capital flow was headed out of the market, and bears were still strong.
Conclusion
The indicators were somewhat conflicting, but on the price chart, the market structure remained bearish. A move past $106 and a higher low registered following that would be the first sign of a change in longer-term bias for SOL. At the same time, a push toward $100-$115 could still turn out to be a liquidity grab. Hence, risk-averse market participants would want to see Solana flip the $105 and $120 areas from supply to demand.