Holding ADA in your portfolio but don’t want to cut losses? Read this
![Here's how Cardano's [ADA] progression could play out in light of this..](https://ambcrypto.com/wp-content/uploads/2022/08/Untitled-design-6.png)
Disclaimer: The findings of the following analysis are the sole opinions of the writer and should not be considered investment advice.
Cardano’s [ADA] recent reversal from the $0.546 ceiling saw a buying pressure renewal from the 200 EMA (green). Over the last three days, ADA’s descending channel (white) break out in the 4-hour timeframe saw stagnation in the $0.5-$0.51 resistance range.
The broader perspective for ADA took a rather neutral stance with a slight edge for buyers. Especially, after the altcoin’s close above the 20 EMA (red) and the 50 EMA (cyan), the bulls would strive to escape the shackles of low volatility. At press time, ADA was trading at $0.51.
ADA 4-hour Chart
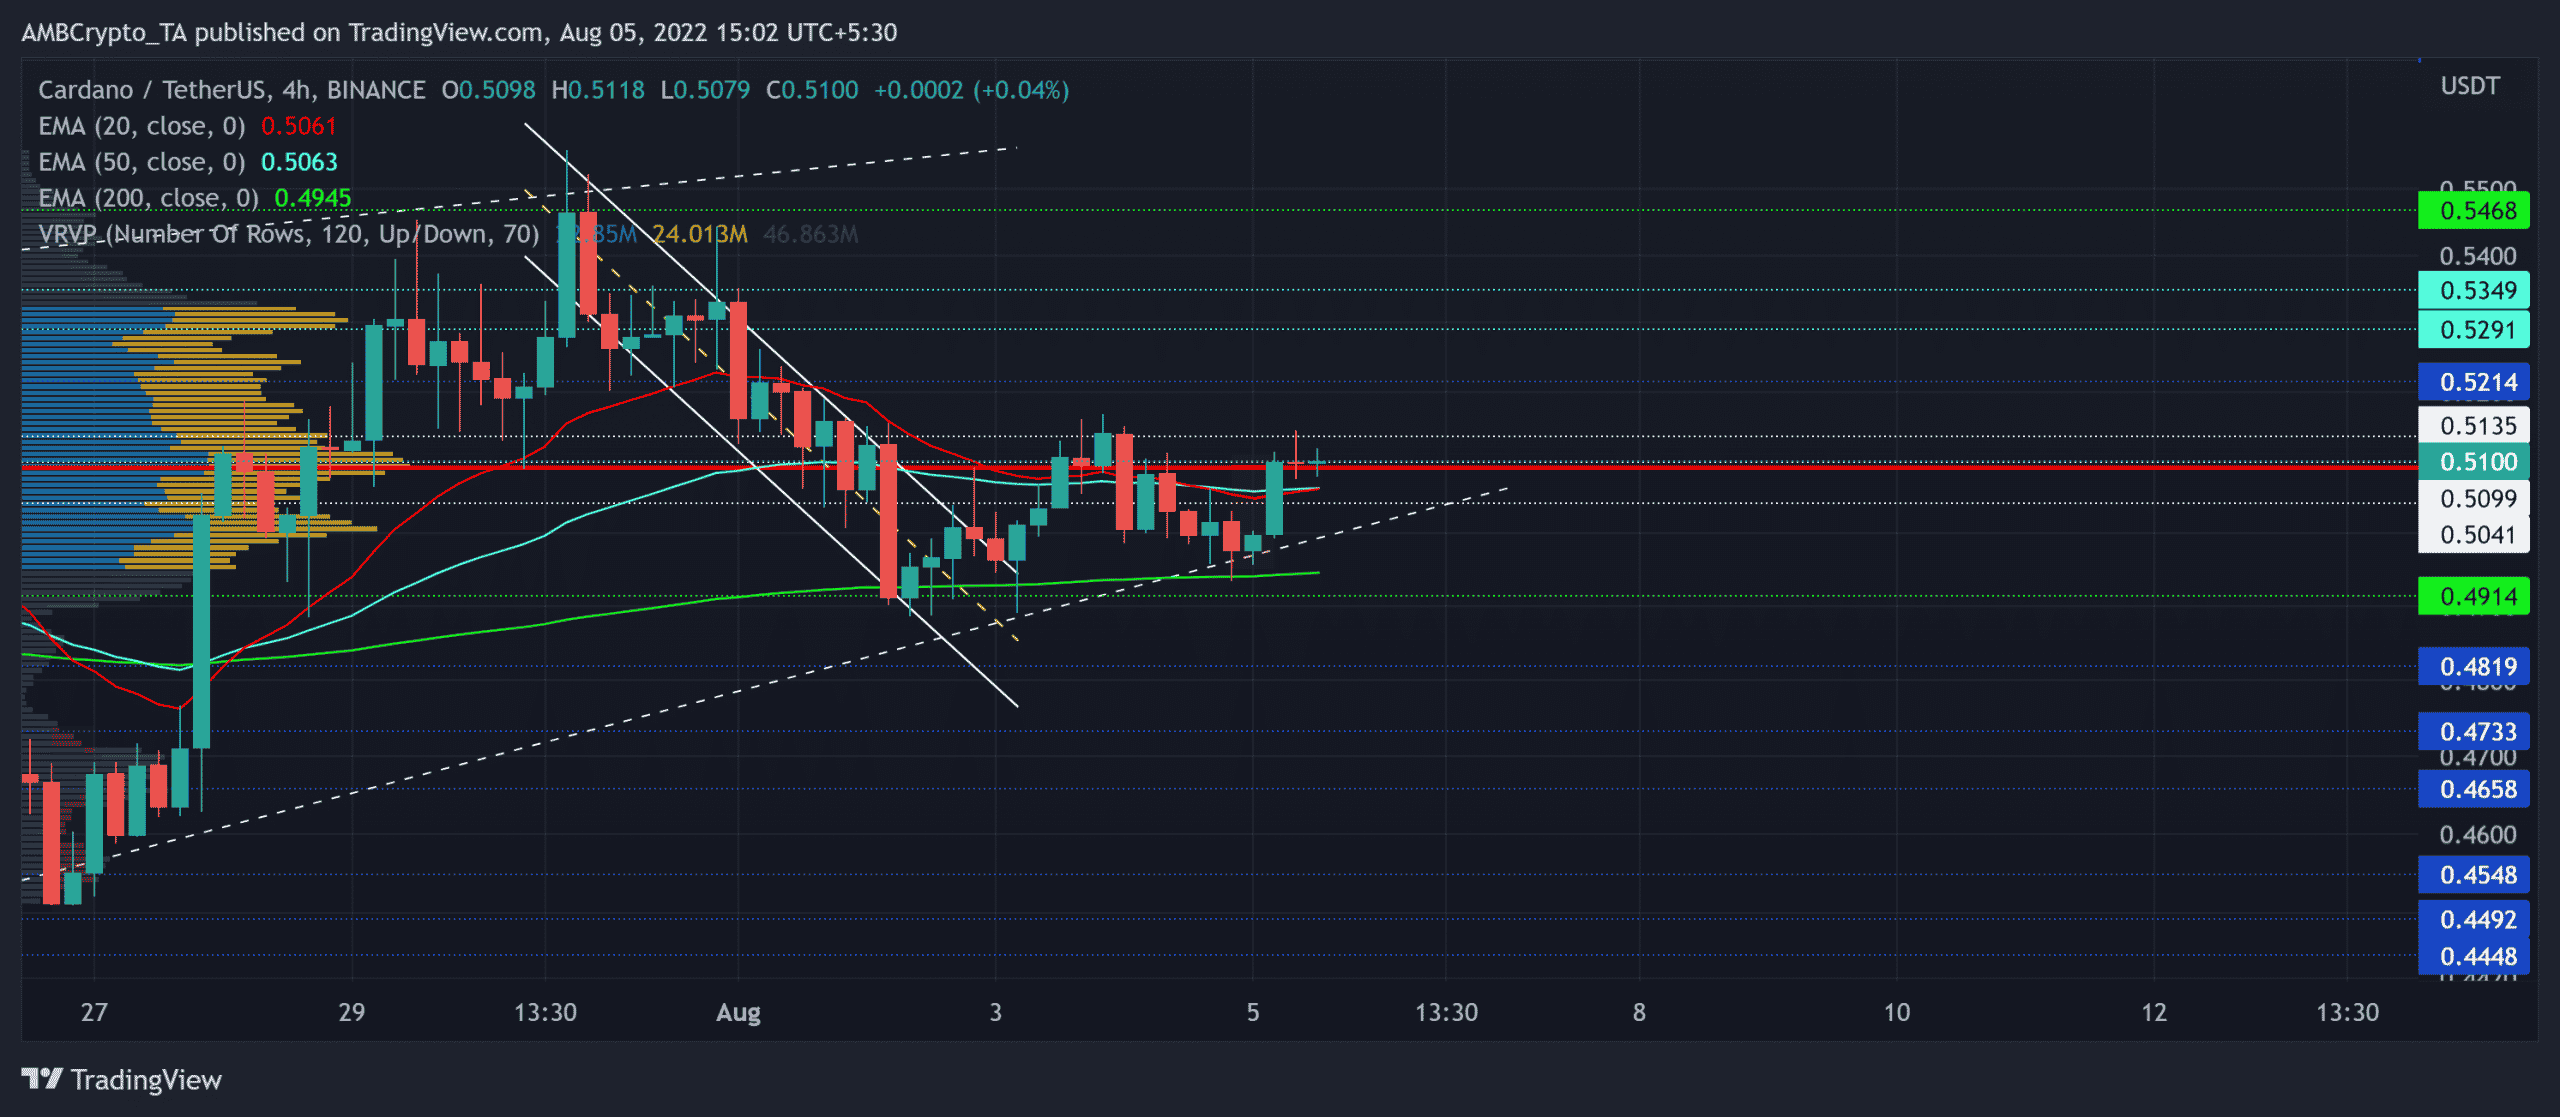
As the down-channel trajectory infused a bearish pull below the 20/50 EMA, the near-term narrative for the alt took a toll. However, the 200 EMA coincided with the three-week trendline support (white, dashed) to build a solid support zone.
This support level propelled a patterned breakout that struggled to hover beyond the Point of Control (POC, red) in the $0.509 zone. Meanwhile, the price action entered into a relatively low volatility phase. So, an inability to inflict a strong bullish move could extend the sluggish behavior in the coming sessions.
Further, the prospects of an effective morning star pattern would considerably heighten if the current candlestick closes at a higher closing price.
With the rejection of higher prices in the $0.5 zone, ADA could see compression near the POC. An immediate buying resurgence above the Point of Control (POC, red) could pave a recovery path toward the $0.52-$0.54 range.
Any close below the trendline support could invalidate the bullish tendencies.
Rationale
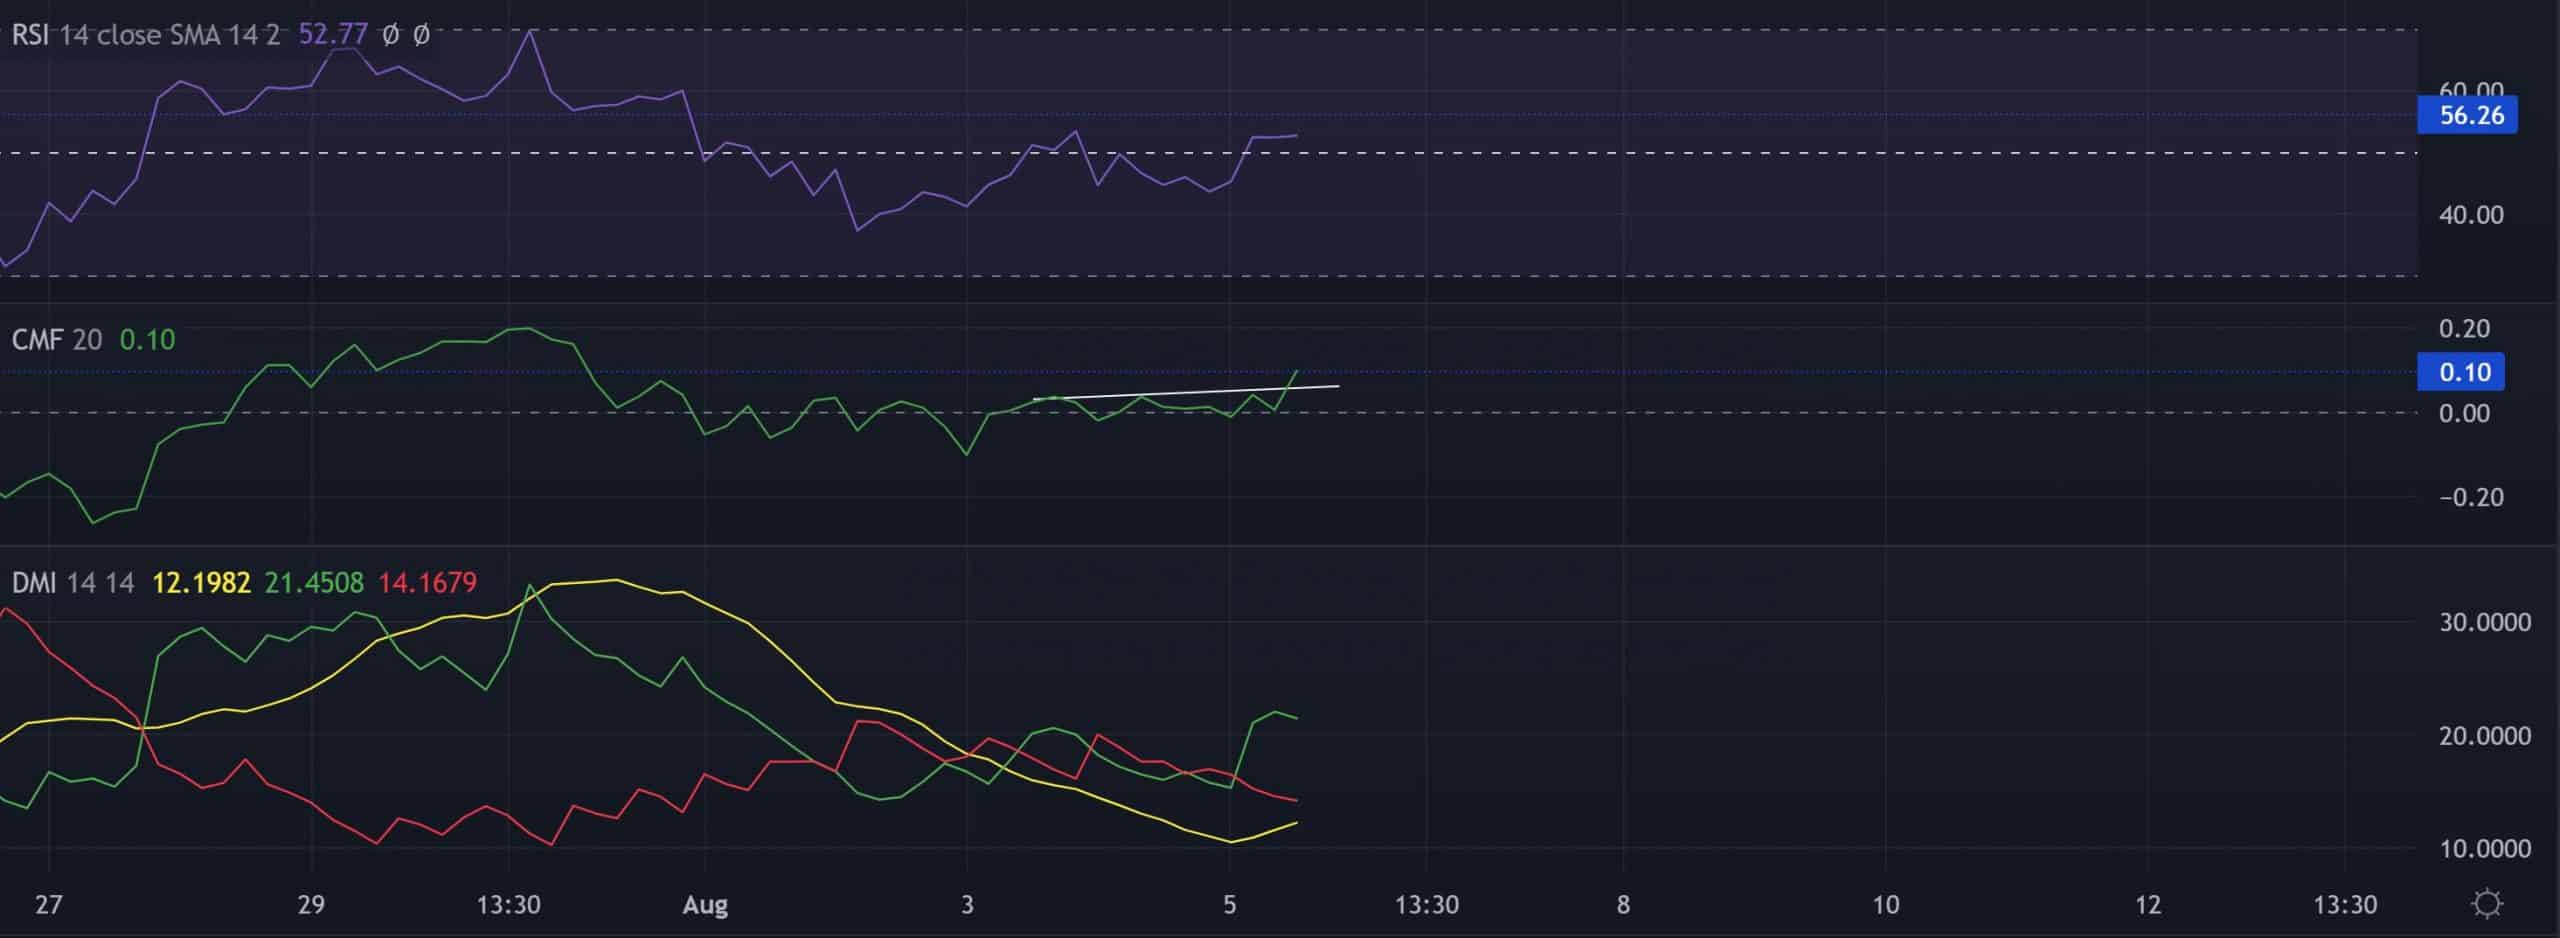
The Relative Strength Index displayed neutrality while hovering near the equilibrium.
A compelling close beyond the 56-level can aid the buyers in recouping their forces to propel a volatile break.
Further, the CMF marked higher troughs over the last two days and affirmed a bearish divergence with the price. So, reversals from its immediate resistance level could hamper the near-term buying efforts.
Nevertheless, the Directional Movement Index (DMI) exhibited a strong bullish edge. But the ADX of ADA revealed a substantially weak directional trend.
Conclusion
While the 20 EMA strived to jump above the 50 EMA, the buyers could claim a near-term edge. A close above the $0.51-level ceiling could confirm these bullish inclinations. The targets would remain the same as above.
Finally, traders/investors should keep a close watch on Bitcoin’s movement and its effects on the wider market to make a profitable move.


