
Disclaimer: The findings of the following analysis are the sole opinions of the writer and should not be considered investment advice
Avalanche has been trading within a range for the most part in 2022, but the AVAX buying activity indicated the coming weeks could see gains.
At the same time, daily trading volume has fallen heavily in the past month, even though buyers appeared to have the upper hand. The Social Dominance metric saw a slight spike as well. Now, the question is- What does this mean for the price?
AVAX- 12 Hour Chart
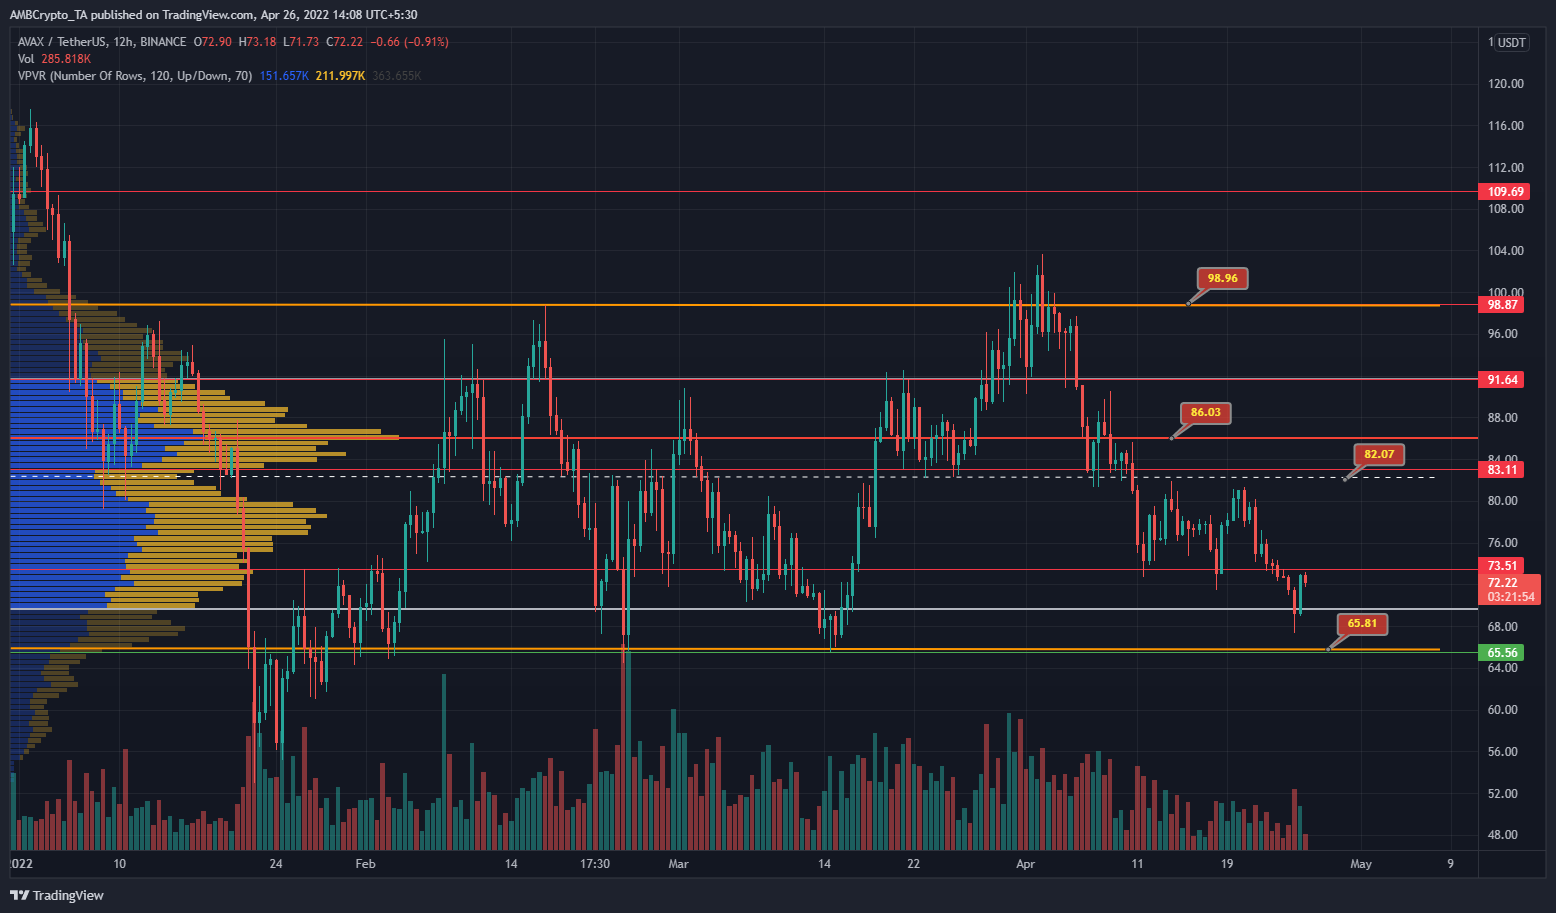
Source: AVAX/USDT on TradingView
In orange is a range that AVAX has traded within since late January. This range extends from $65.81 to $98.96, with the mid-point at $82.07. The Volume Profile Visible Range tool showed the Value Area Highs and Lows for the same time period to lie at $70.3 and $91.6 respectively, and the Point of Control at $86.
At press time, the price bounced from the Value Area Lows, which was encouraging for the bulls. The $64-$70 area could be used by long-term investors to dollar-cost-average into an AVAX long position. At the same time, the range highs near $96 can be used to sell the asset.
Rationale
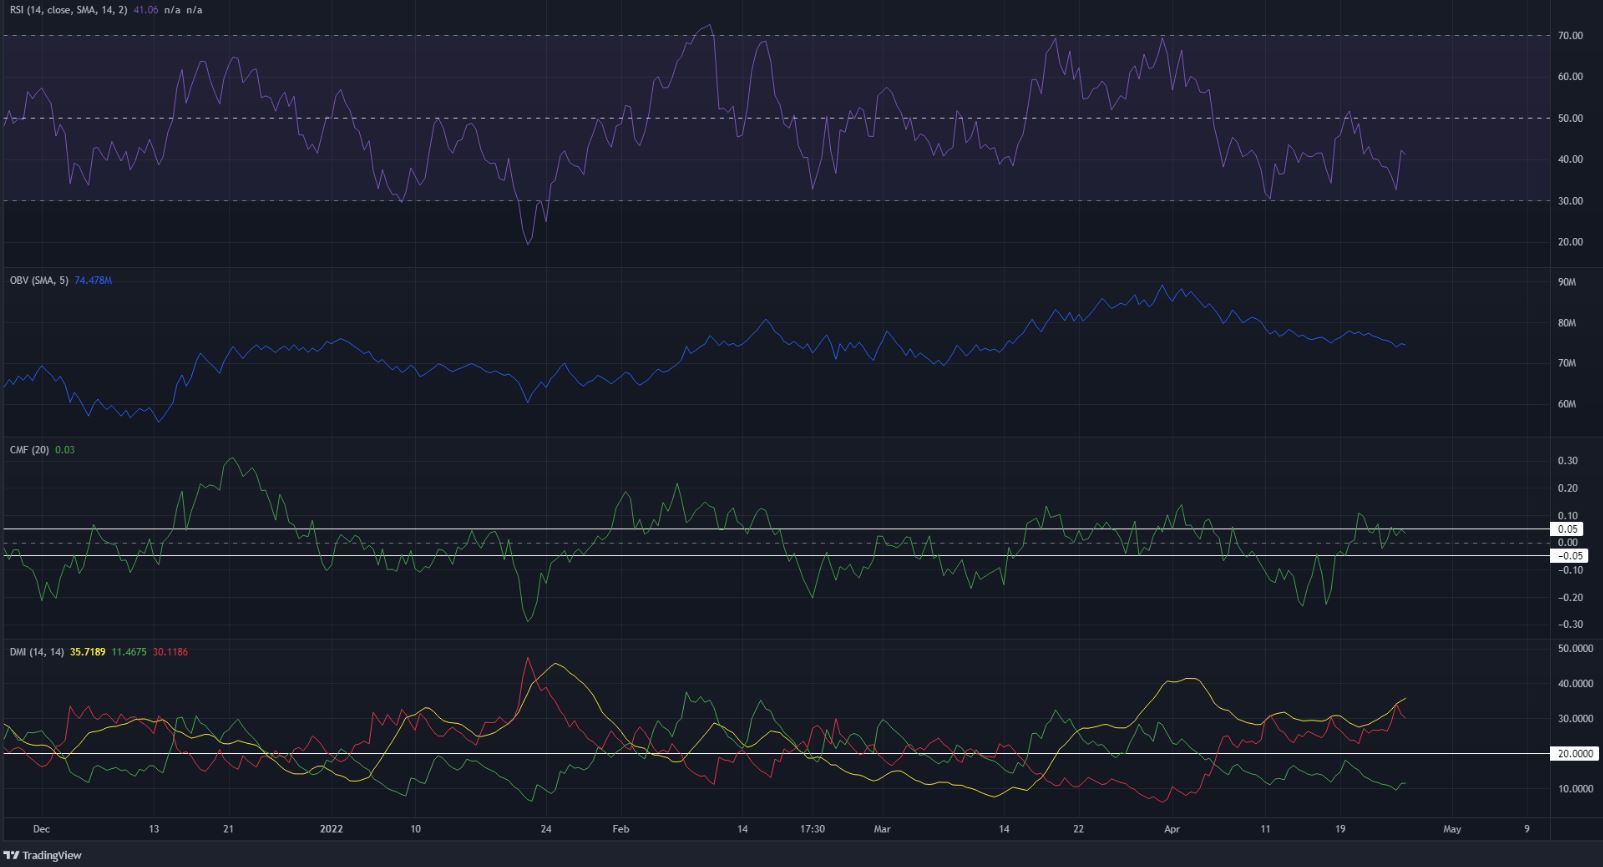
Source: AVAX/USDT on TradingView
The RSI has shown periods of strong upward and downward trends during the time AVAX has been within this range, by staying above or below neutral 50 for extended periods of time. The past two weeks have been a downtrend according to the RSI, as it slipped beneath and stayed below the neutral 50 line.
The CMF was at +0.03 and on the verge of showing capital flow into the market, contrary to the momentum indicators and the price action. At the same time, the OBV has also been forming higher lows
The Directional Movement Index had both the ADX (yellow) and the -DI (red) above the 20 mark and showed a strong downtrend in progress.
Conclusion
The price action showed a downtrend in progress after a rejection at $100 and a drop beneath $91. Things don’t appear to be recovering, as the past few days saw the $73 level fail and, at the time of writing, could be retested as resistance before another move downward.
The OBV alone showed that buying volume outweighed the selling volume in the past few months, despite the price trading within a range. Therefore, long-term investors can use the confluence of the range lows at $65.5 and the Value Area Lows at $70 to dollar-cost-average into long positions.