How MATIC buyers can leverage this strategy to remain profitable

Disclaimer: The findings of the following analysis are the sole opinions of the writer and should not be considered investment advice.
Over the last three months, Polygon [MATIC] bulls restored their edge from the 14-month support at the $0.34-level. The resulting buying comeback propelled a bullish pattern that aided MATIC in retesting the 200 EMA (green).
The altcoin has now entered a critical level in the $0.7-$0.76 range. MATIC could likely see a dull phase given the confluence of resistances in the $0.76 zone. At press time, MATIC was trading at $0.7551.
MATIC Daily Chart

The previous ascending channel breakout growth aided MATIC bulls to breach the $0.7-$0.76 range and flip it to support. Since then, this range has supported MATIC’s retracement over the last month.
After reversing from the 200 EMA resistance barrier, the coin has been struggling to pull off a robust buying rally. After a brief down-channel oscillation, the 20 EMA (red) dropped below the 50 EMA (cyan) to depict a selling edge.
With these EMAs still looking south, the sellers could aim to restrict the buying rallies in the $0.79-$0.81 range. A close below the $0.7-mark would position the coin for a near-term downside. In this case, the potential target would lie in the $0.607 region.
An eventual close below the $0.81-mark can provoke a bearish invalidation. The bulls must ramp up the buying volumes to sustain a close above the immediate resistance range. In these circumstances, the buyers would look to retest the 200 EMA before a likely reversal.
Rationale
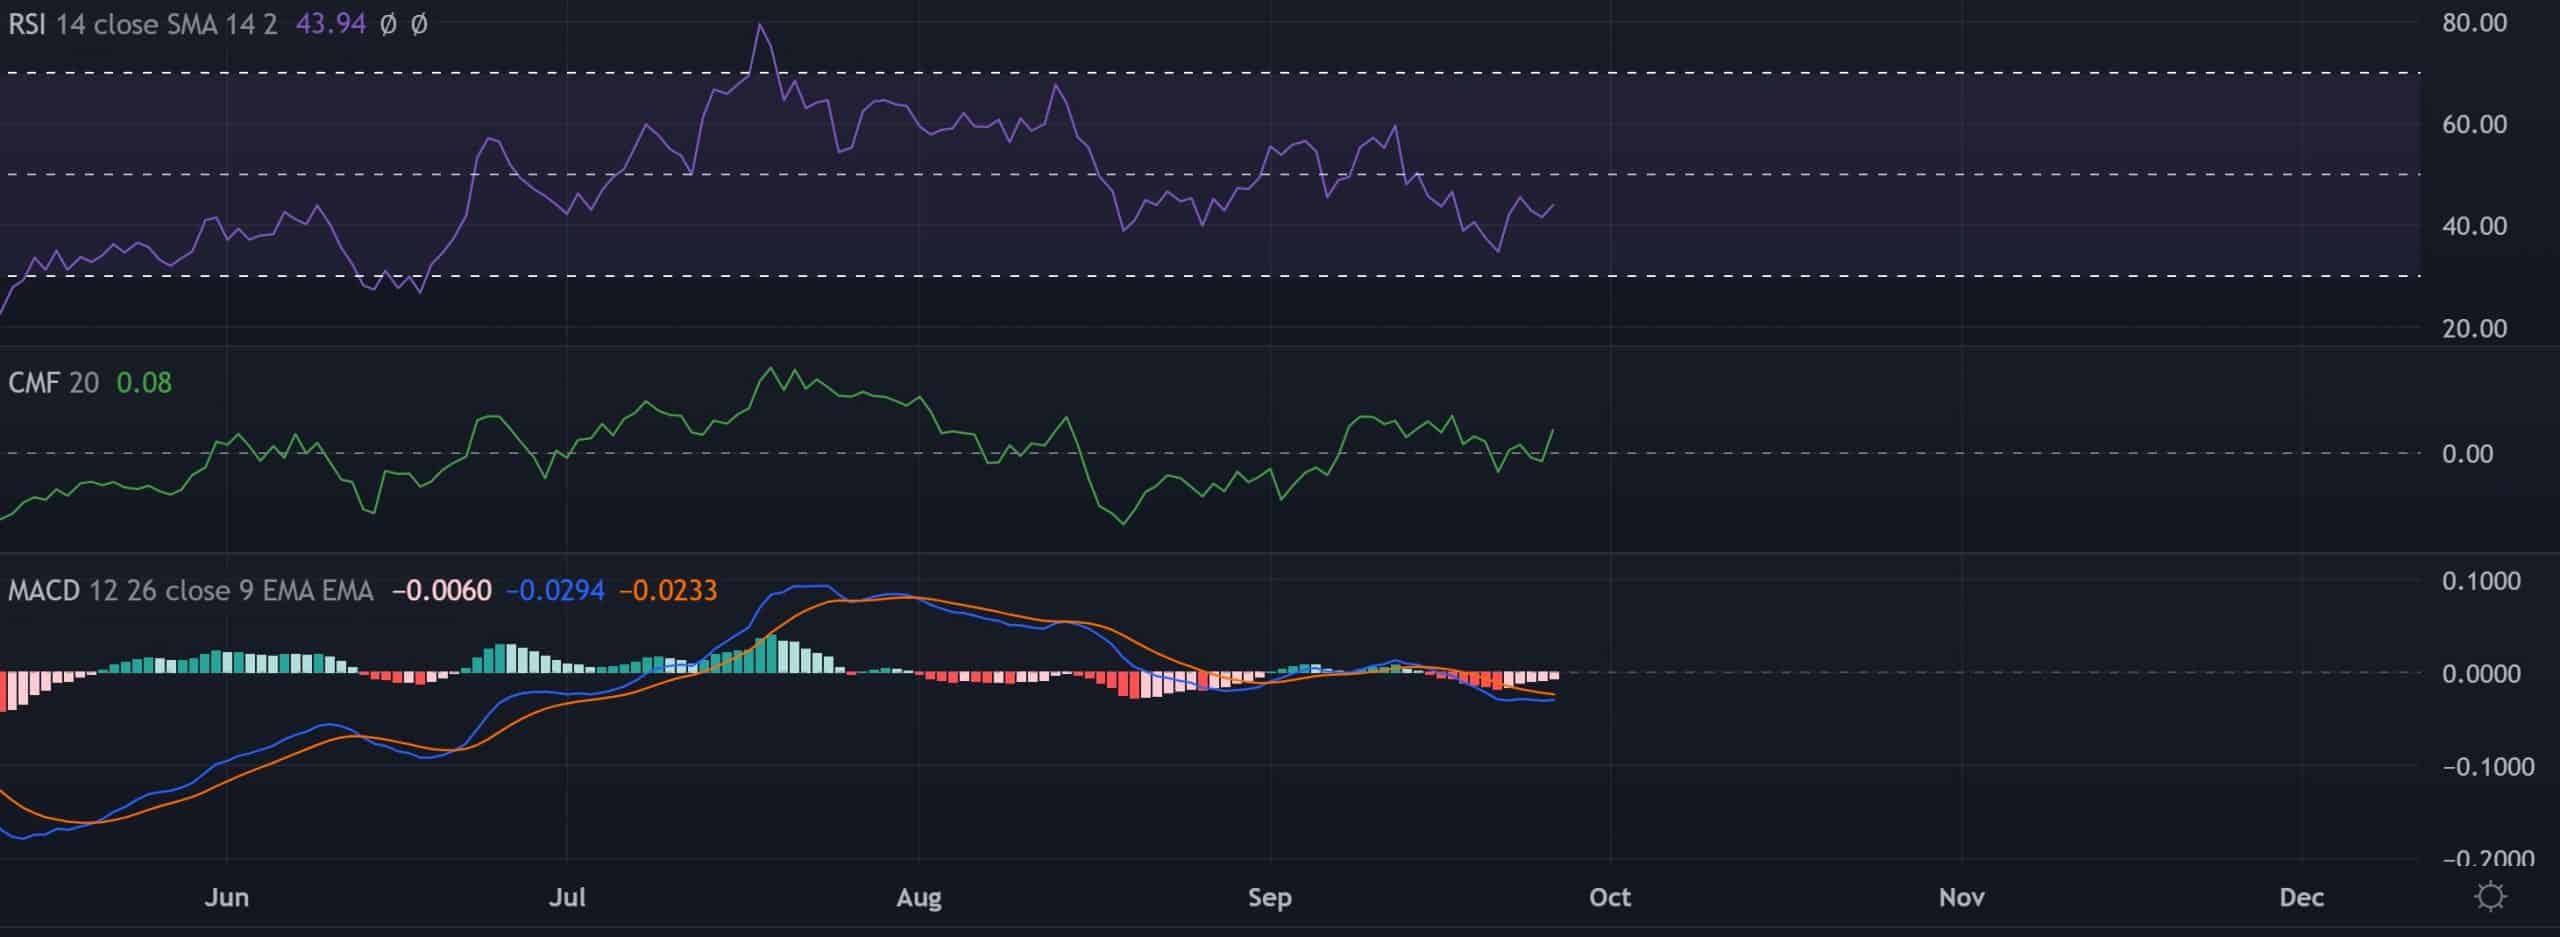
The Relative Strength Index (RSI) marked some improvements as it eyed to test its equilibrium. A close beyond the 50-mark resistance would confirm a change in momentum.
Furthermore, the Chaikin Money Flow’s (CMF) position above the zero mark also resonated with the increasing bullish strength. Nevertheless, MACD was yet to undertake a bullish crossover. The buyers should look for this crossover before taking a long position.
Conclusion
MATIC’s position below the 20/50/200 EMA has depicted a broader bearish edge. A decline below the $0.7 baseline would reignite the near-term bearishness.
On the other hand, a close above the $0.81-mark would hint at a near-term bearish invalidation. The targets would remain the same as discussed.
Finally, investors/traders must keep a close eye on Bitcoin’s movement as MATIC shares a 78% 30-day correlation with the king coin.