How next few days could pan out for SAND, what to expect

Friday started off on quite a pessimistic note. It was more like a ‘don’t check your portfolio’ kind of day. Along side Bitcoin and Ethereum, tokens from almost all the categories took the fall.
Meta-tokens were no exceptions to the broader dump. In fact, their wounds seemed to be deeper than most coins. While top coins shed 2%-4% of their respective values over the past day, meta/gaming tokens ended up depreciating by 8%-12%.
SAND, the third largest token by capitalization belonging to the latter category, witnessed a 11% loss in value in just a day’s time. Parallelly, its weekly dip totaled to a little over 22% at the time of this analysis.
SAND to sink further?
Well, to come to a plausible assertion, let’s analyze the state of state of token’s metrics.
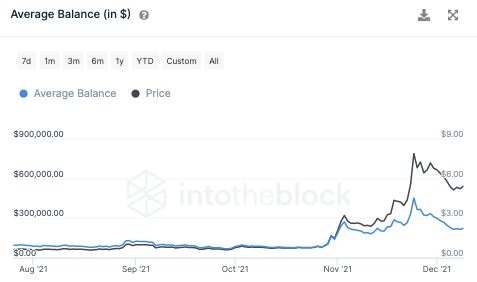
To begin with, consider the average balance. As per data from ITB, the average HODLer balance had crossed the $450k threshold towards the last week of November. It has, however, halved since then and currently stands around $220k.
The downhill movement of the average balance means that market participants have been abandoning their tokens of late. In fact, the order book stats and the trades per side metrics’ readings further supported the aforementioned assertion.
So, if the whole profit-booking and exiting frenzy continues, SAND would find it challenging to negate its losses.
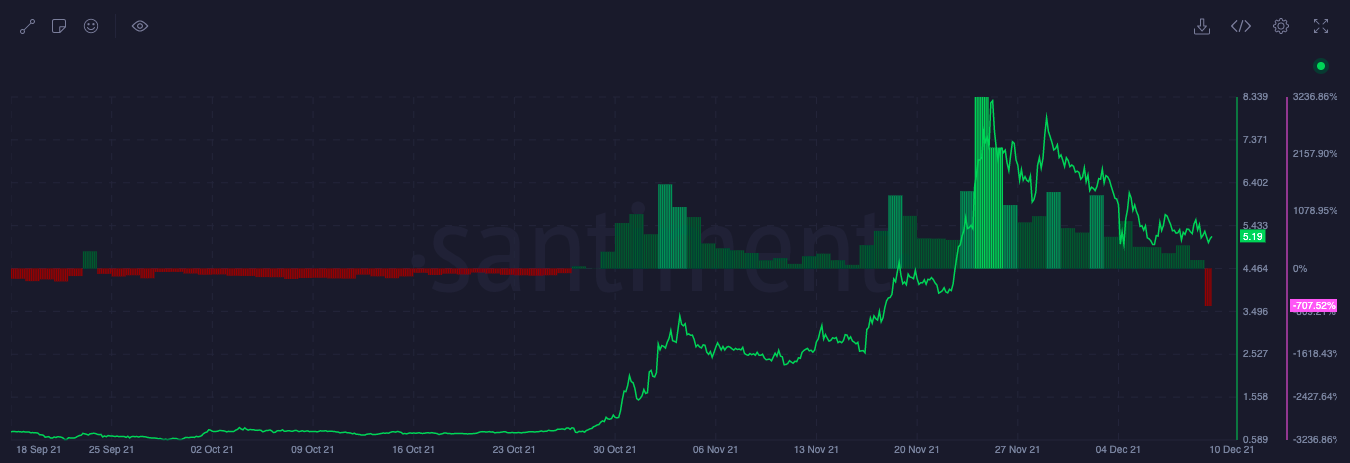
The sell-trend additionally coincides with a dip in the active addresses ratio. When compared to the end-of-November’s 17.4% peak, this this metric merely reflected a reading of 3.4% at the time of this analysis. Users departing from the ecosystem is not a trend to look forward to, especially when the market is bearish.
Further, even on the price DAA divergence chart, bearish streaks have started making their presence felt, which isn’t a good sign.
The sliver lining
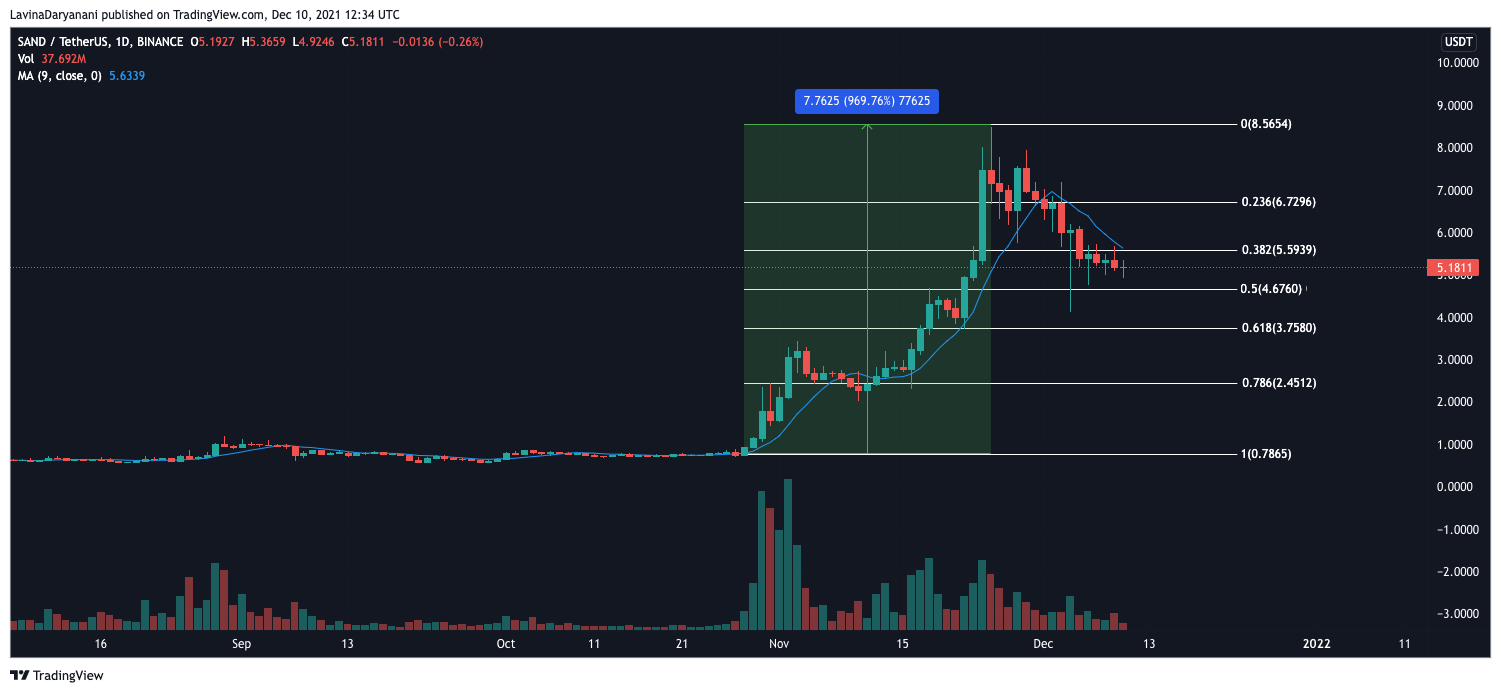
Despite the not-so-favorable state of the metrics, things did seem to be fairly optimistic on the token’s price chart. The coin did slip below its 38.2% Fibonacci level earlier this week, but has restricted itself from extending its losses further. Over the past 5 days, SAND’s price has not fallen below $4.6 or the 50% Fib level. So, if the same continues to act as support and aids the coin, SAND could gradually initiate a change in trend.
Further, ITB’s data highlighted that this token currently shares a negative correlation with Bitcoin [-0.54, to be precise]. And as highlighted in an article earlier today, the odds of Bitcoin standing back on its feet seem to be quite bleak for now. In effect, SAND is in quite a good position to take advantage of the same.
It is more or less a matter of time until the buying bias kicks into the SAND market. And when that happens, the state of most of the aforementioned metrics would improve. Consequentially, it would then make sense to expect SAND to inch up north to $6 and beyond.