ICP: Despite the strong surge recently, here is why shorting could be profitable

Disclaimer: The findings of the following analysis are the sole opinions of the writer and should not be considered investment advice.
ICP surged by nearly 30% over the previous day but was forced to pull back from the $9.8 resistance zone. Can bulls break this supply zone? The trading volume was high, which suggested strong demand. Yet, the higher timeframe market structure remained bearish, even though the lower timeframe structure suggested further gains toward $10.4 could occur. A bullish Bitcoin might also catalyze a move upward, but the weekend was approaching, which could see heightened volatility.
ICP- 2 Hour Chart
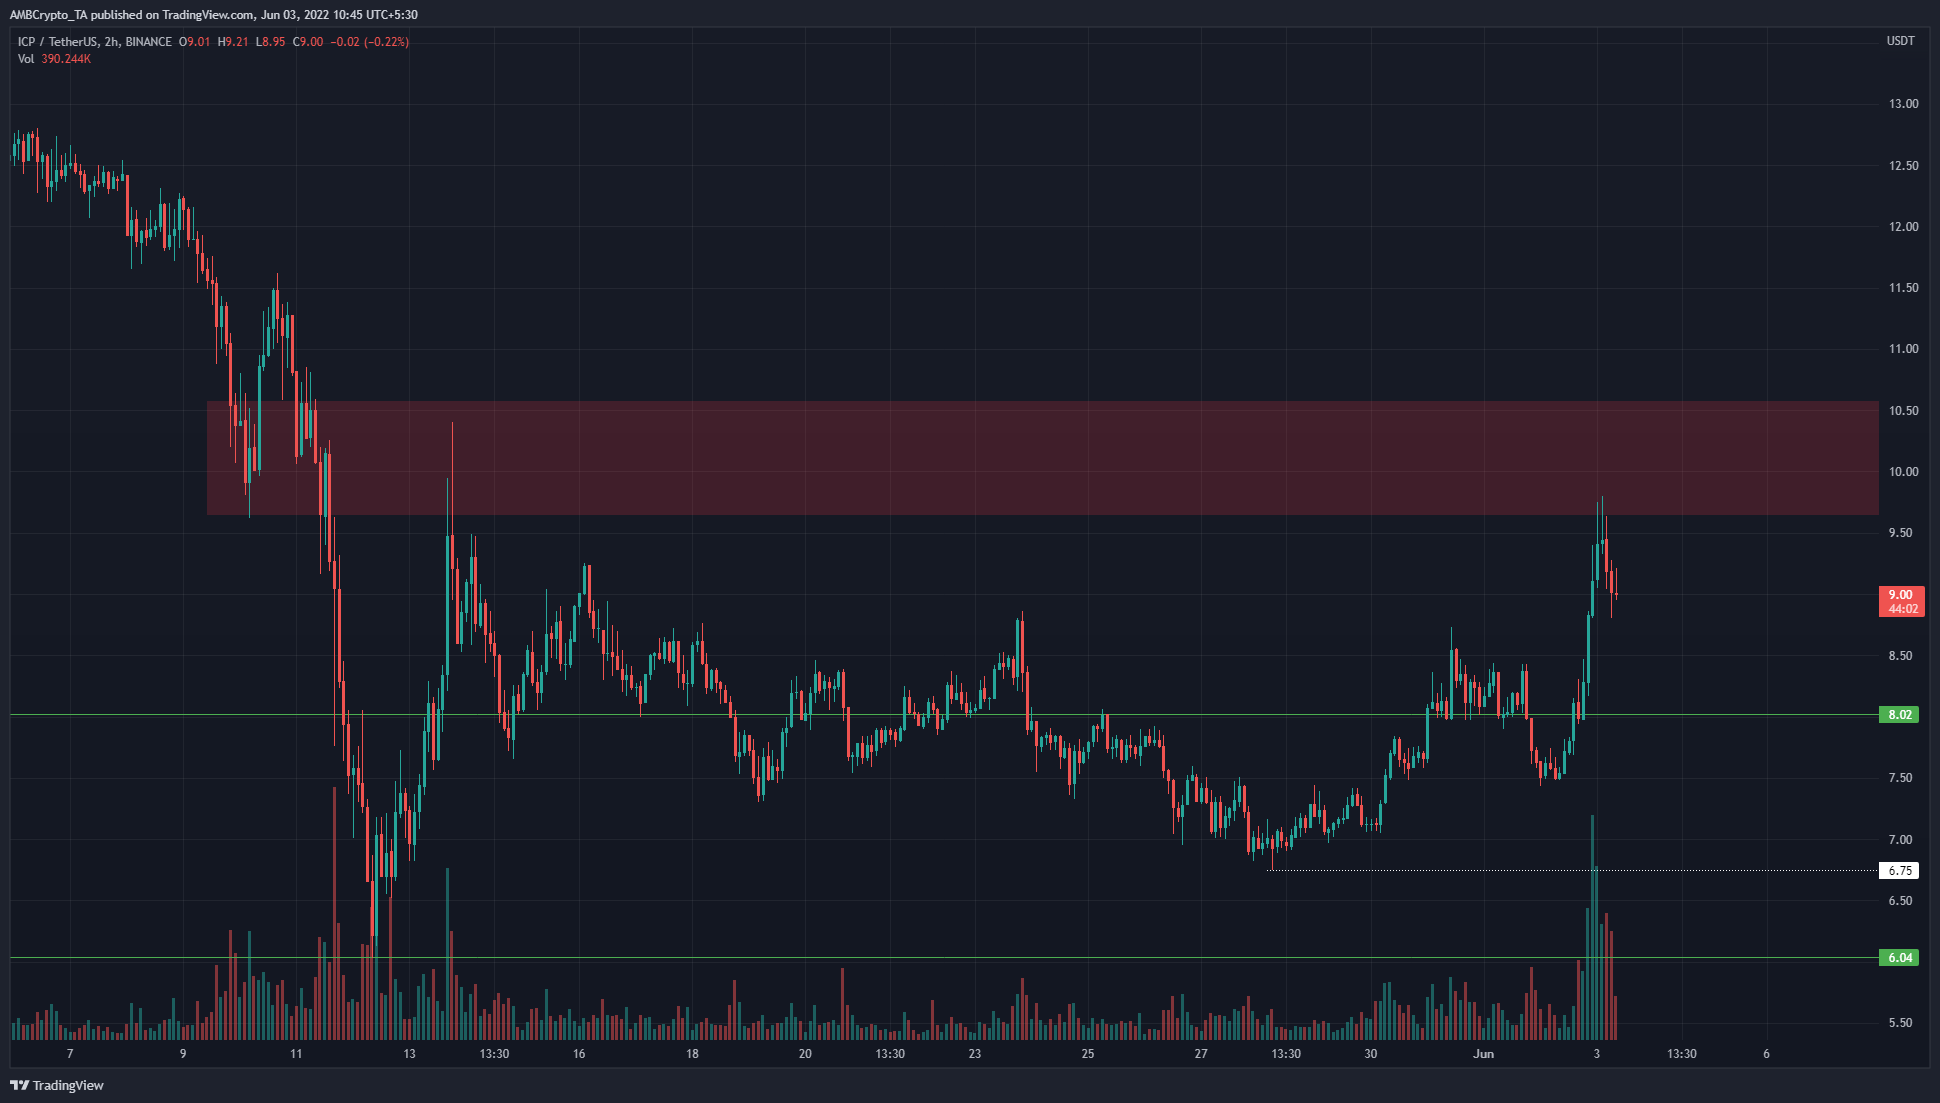
In early May, ICP had been steadily declining and formed a series of lower highs. Two of them are visible on the H2 chart, the $11.5 and $10.38 lower highs. However, over the past week, the price has set higher lows from the $6.75 (dotted white) and has also broken the lower timeframe bearish structure by climbing past the $8.9 level.
Putting it together, the inference was that ICP has a bullish outlook on the lower timeframes until it closes a trading session below the $7 mark. It still has a bearish bias based on higher timeframe charts, which would change if the price can force itself past the $10.38-$10.5 zone of resistance.
The higher timeframe bias is stronger, therefore, if ICP rises toward the $10 area once more, it would offer a shorting opportunity. A rather wide stop-loss can be set just above the $10.5 level.
Rationale
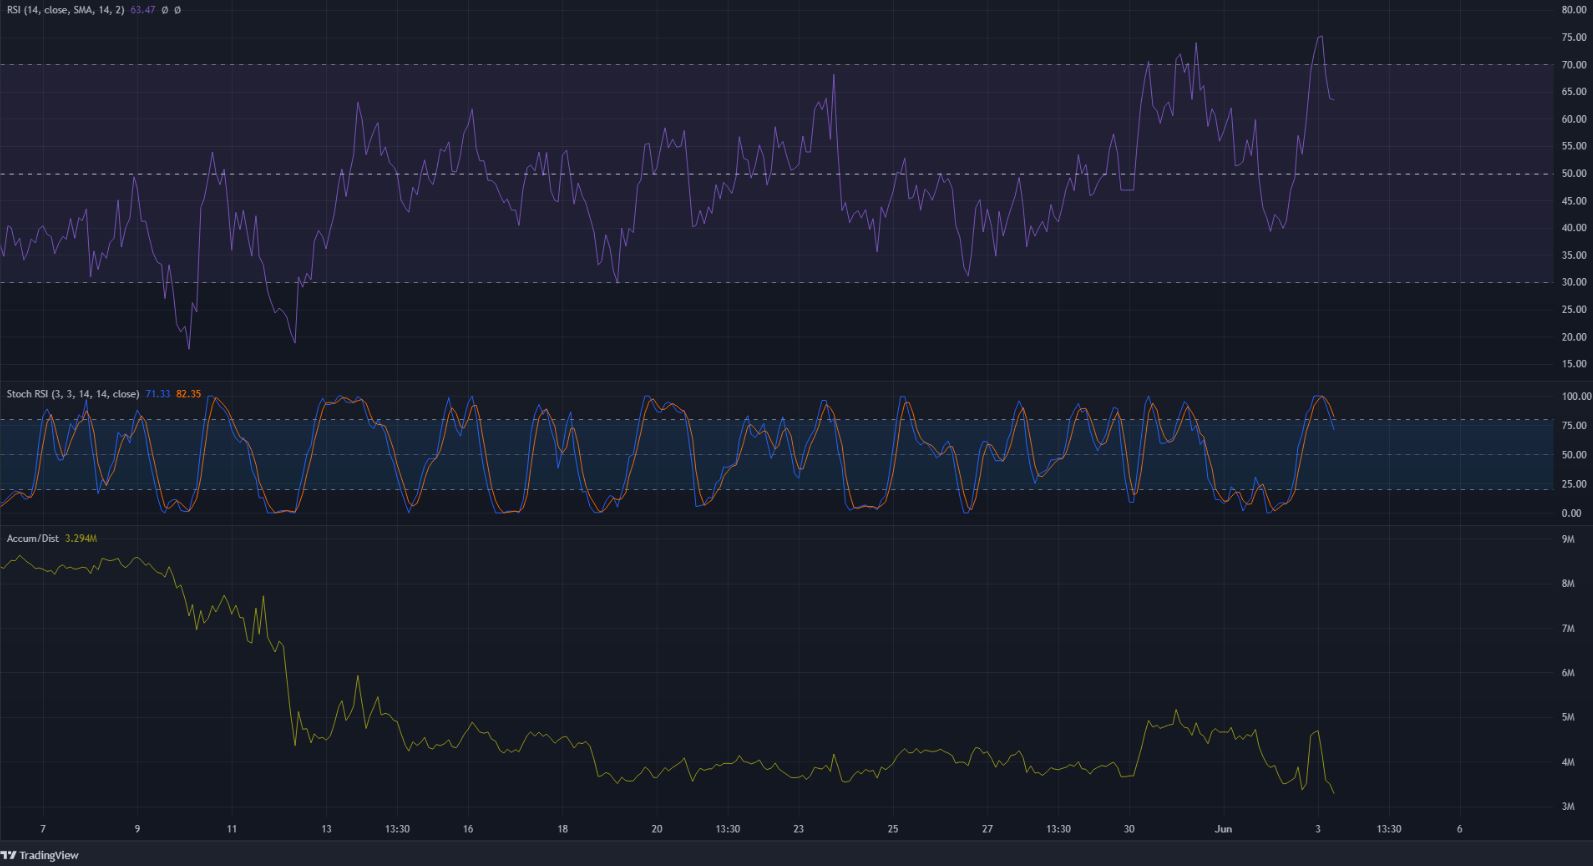
The H2 RSI showed strong bullish momentum and was able to push past the 70 mark in recent hours. The Stochastic RSI formed a bearish crossover in overbought territory, which meant that the RSI and the price had some room to fall lower. The momentum would remain in favor of the bulls as long as the RSI doesn’t flip neutral 50 to resistance.
The A/D, on the other hand, did not show as strong a surge as the prices did. In fact, it appeared to form a lower high from the 13 May mark, which suggested that a trend reversal was not in sight but rather the downtrend could continue.
Conclusion
Why would a trader short an asset that just pumped 30% within a day? The higher timeframe bias remained bearish and the strong surge took ICP right to the doorstep of a bearish bastion. Therefore, entering short positions in the $10 area could be profitable, and risk management would remain crucial.
On the other hand, the $8.8, $8.5, and $8 levels could serve as support and push ICP to the $10-$10.5 area.