Identifying which way is next for Bitcoin based on these metrics

Owing to the price rise Bitcoin saw a few days ago, the market has been consistently bullish. However, the question of where it might be heading now is a hot topic since corrections followed soon after.
How likely is the $100,000 projection now? What will Bitcoin’s next moves look like? On-chain metrics may have an answer on both counts.
Which way is Bitcoin going?
Sideways. Or more like, it is on its way there. This conclusion comes from multiple metrics which seem to be a case of history repeating itself. The possibility of sideways movement arises since Bitcoin has fallen by 9% in the last 4 days. In fact, it was continuing to lose value at press time. Its failure to breach the critical level of $42k brought the coin back down to $38,447.
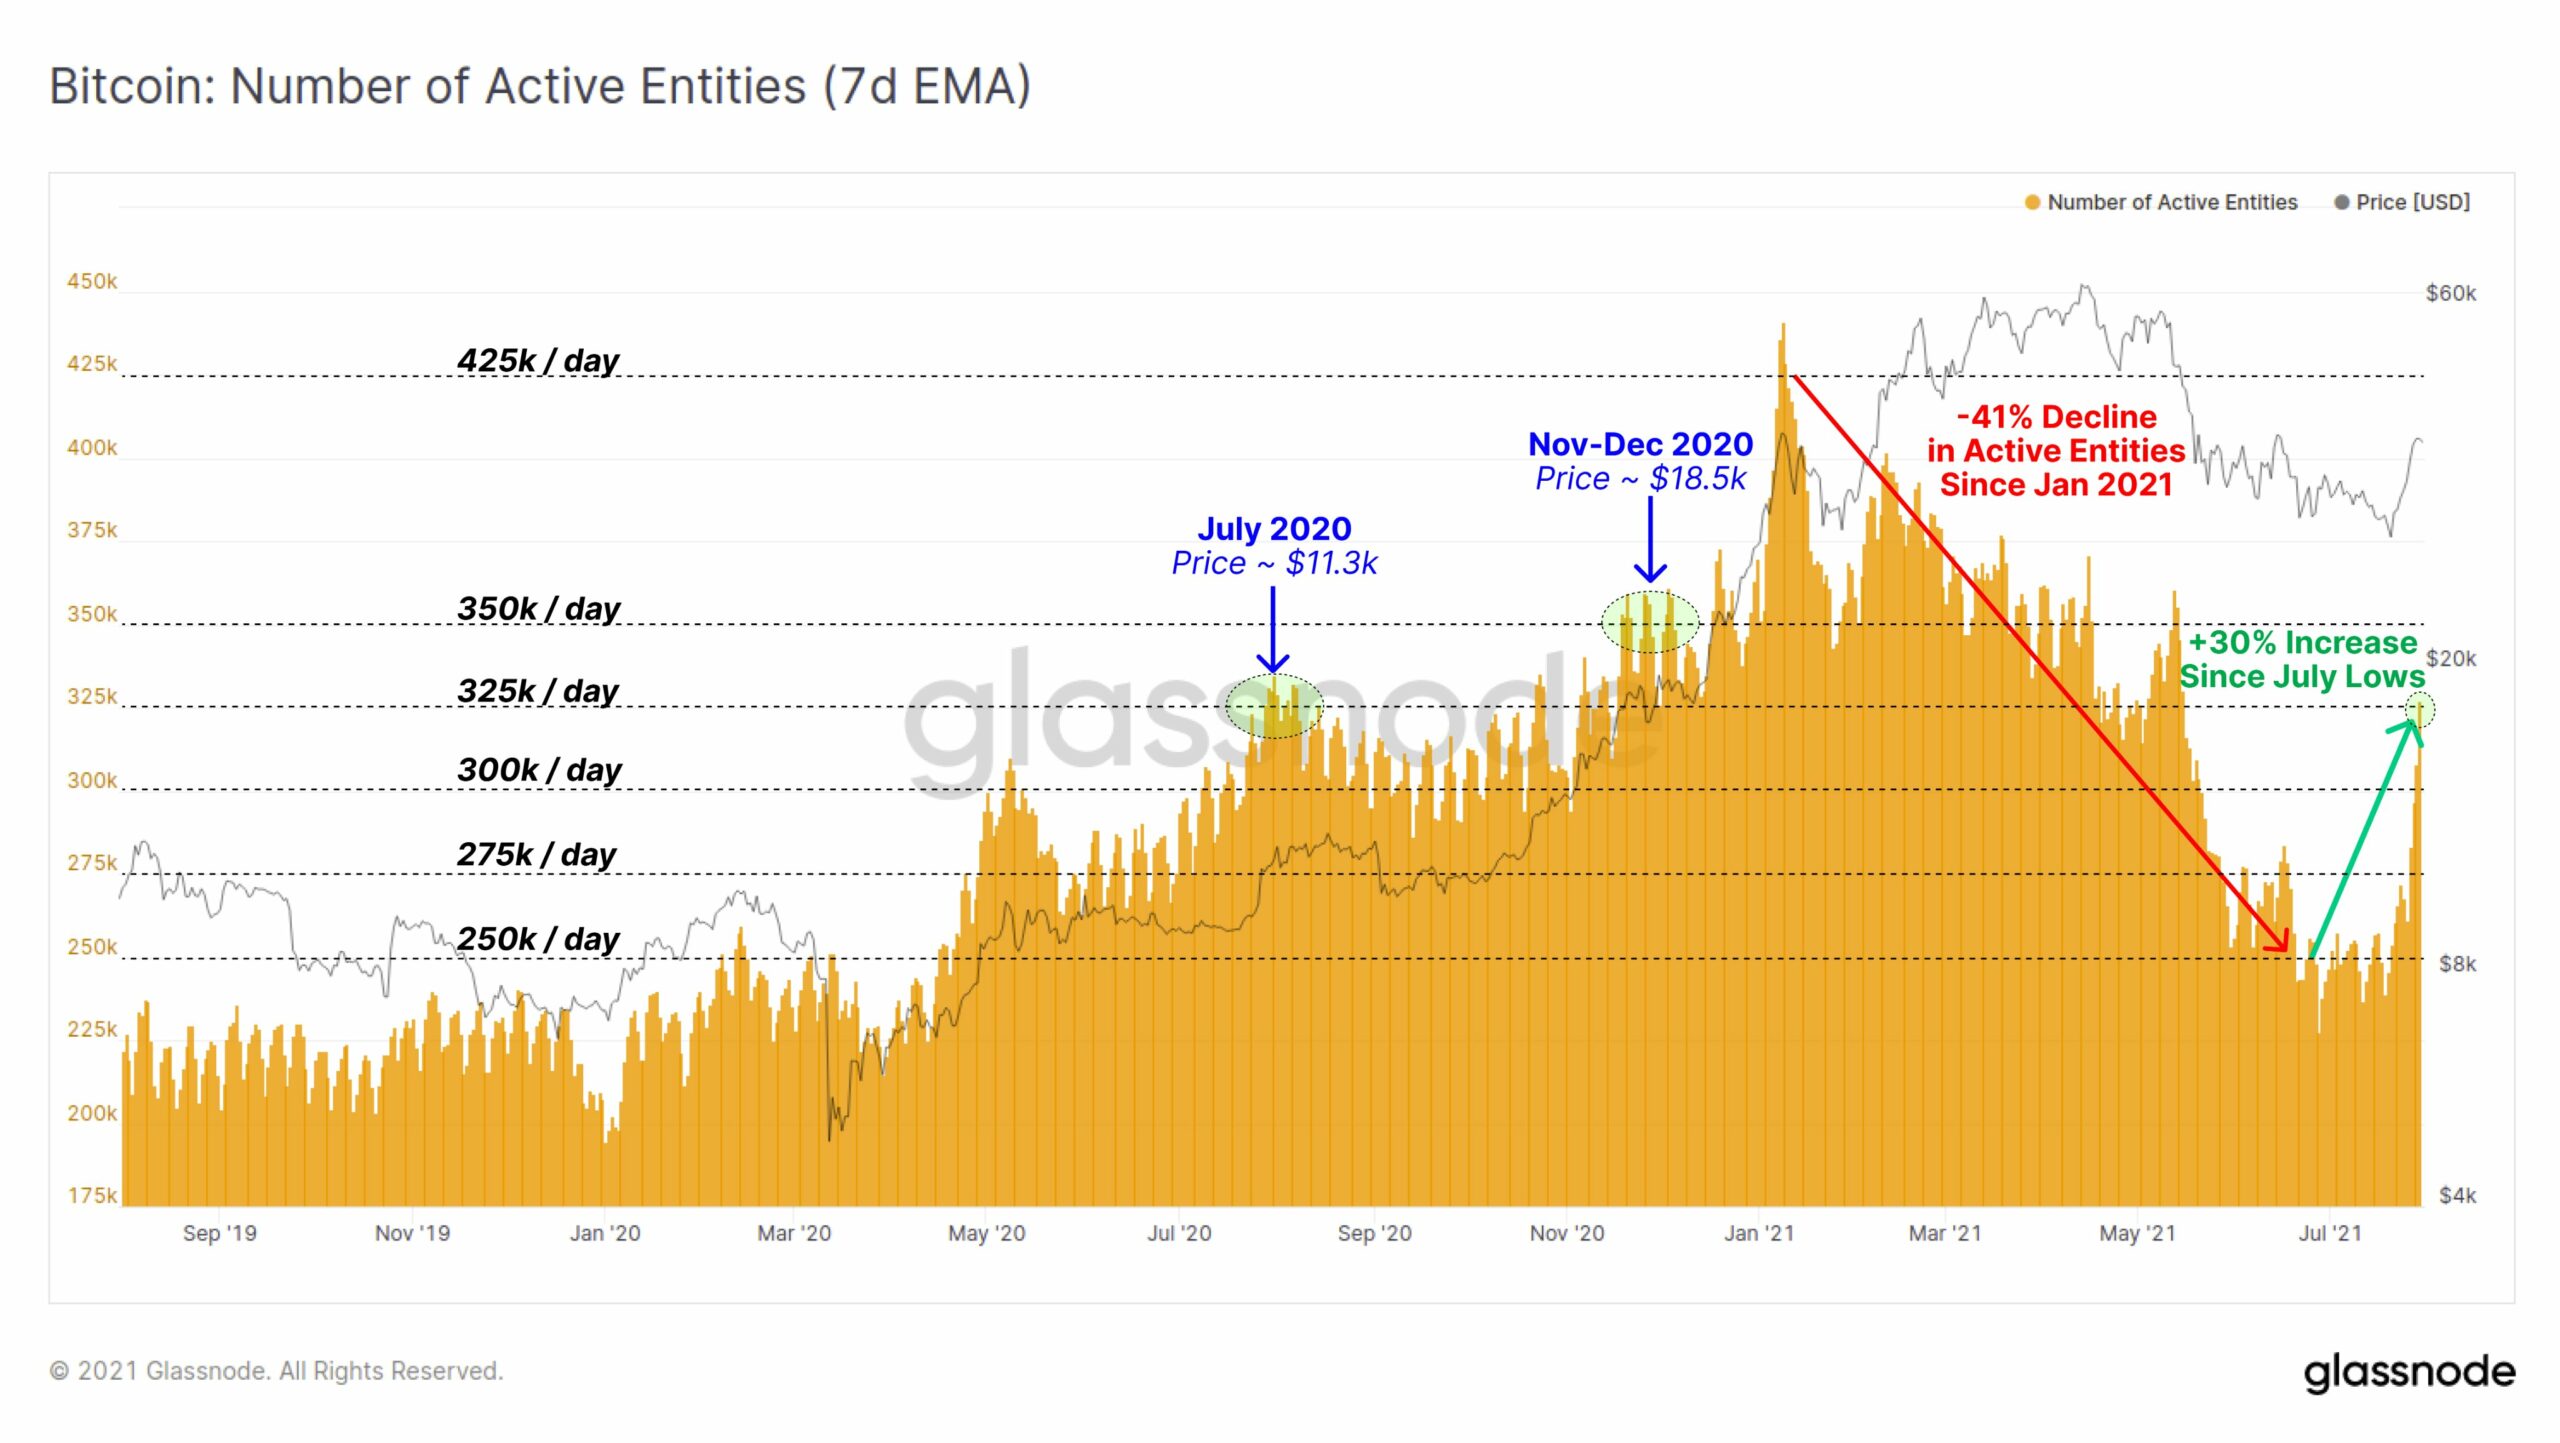
Additionally, Active Entities on the 7-day MA have increased by 30% since the beginning of July. Right now, they are at the same level as they were at a year ago in July 2020.
In fact, it’s also worth looking at the price movement back then. After a minor rally, Bitcoin’s price action was restricted to sideways movement for 2 months straight. This was followed by a slight fall, which then initiated the bull run.
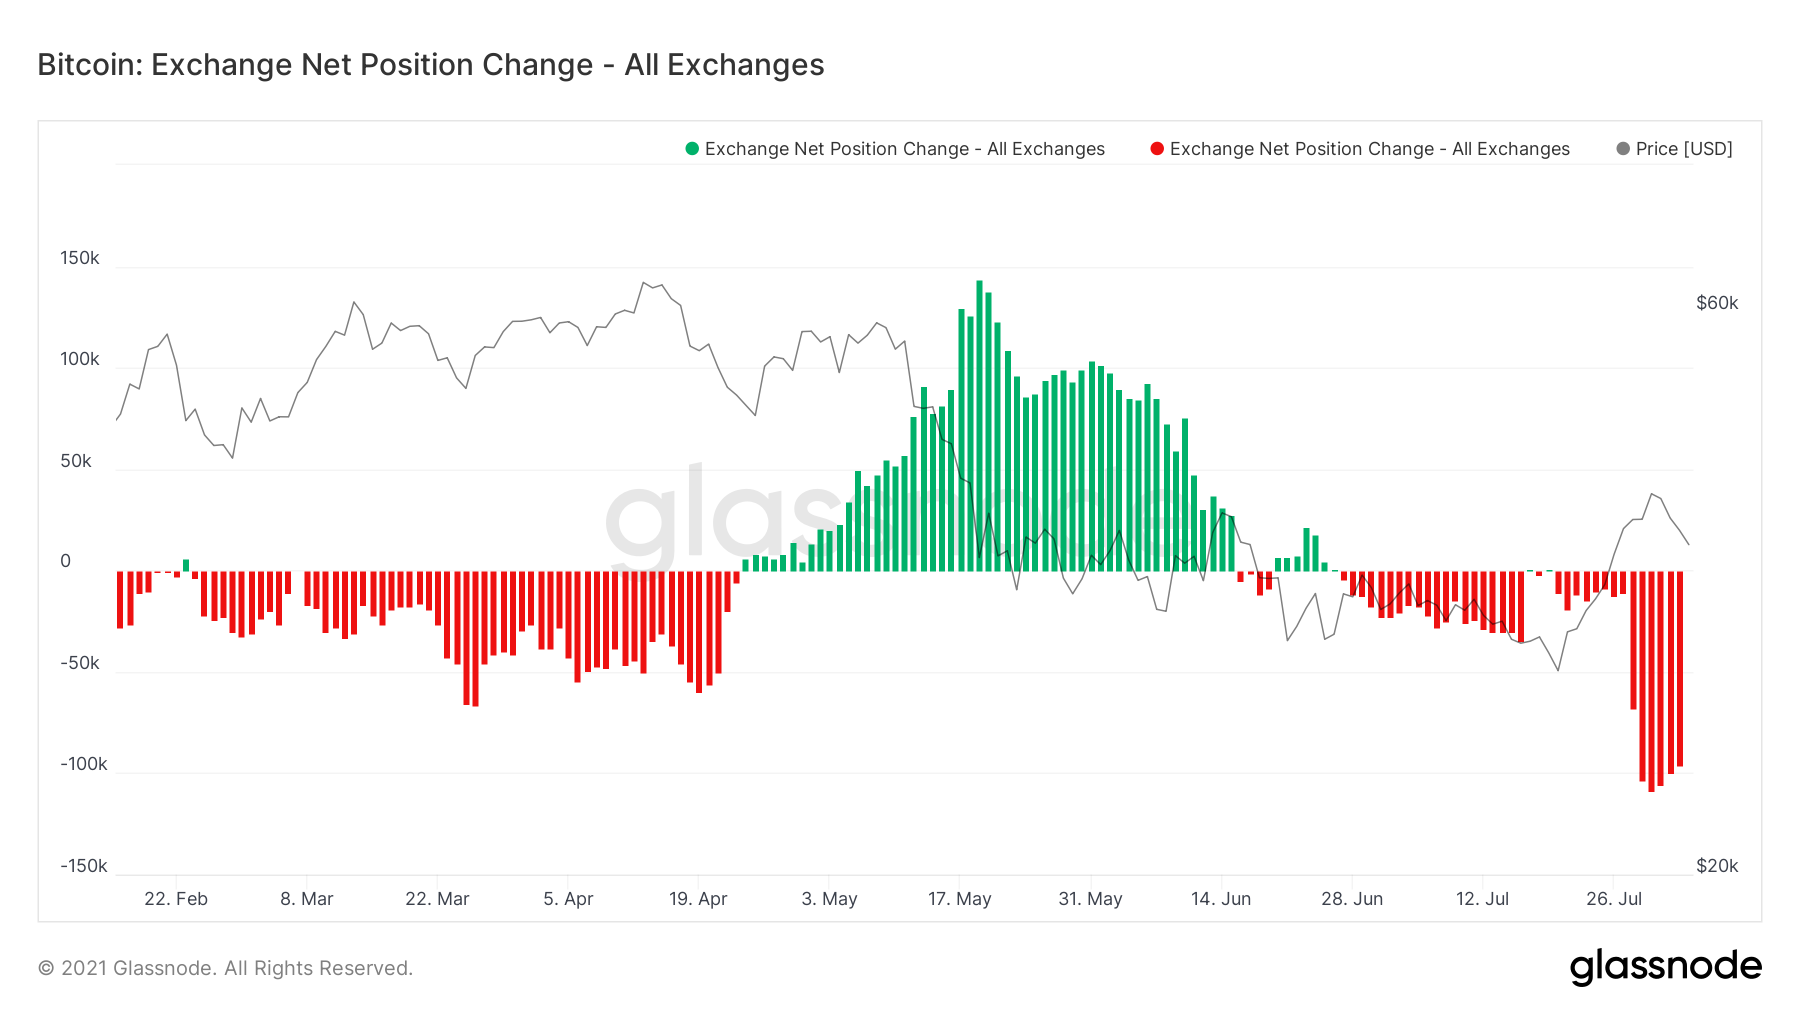
This, combined with the corrections, might point where Bitcoin may be heading. Additionally, the Exchange net position projected an increase in exchange inflows. After touching a 7-month high in terms of outflows, the metric saw inflows taking over.
This could be the result of the aforementioned correction and another sign of lateral movement as selling continues to happen across the board.
What do investors say?
Investors favoring this horizontal movement corresponds with the Fear and Greed Index underlining a neutral sentiment. While it is a significant improvement from its previous position of fear, it did not point to any bullish sentiments either.

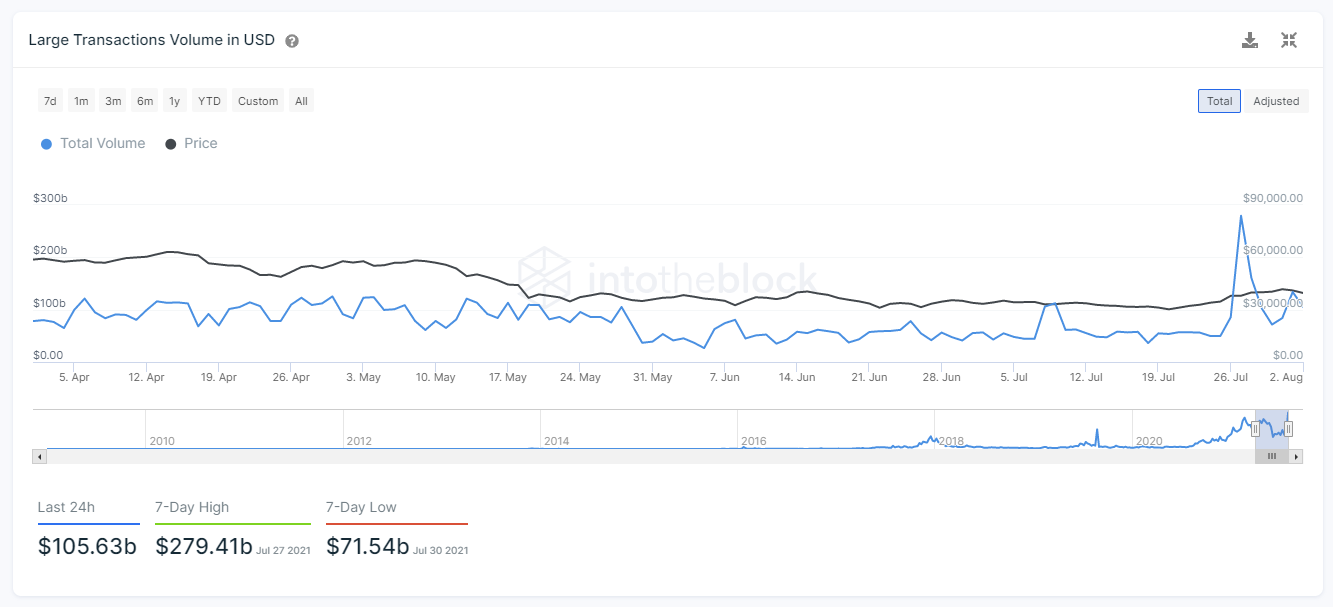
Moreover, large transactions on the network have spiked as well. Large transactions refer to transactions worth more than $100k. And in the last 3 days, the total value of such transactions has increased from $70 billion to $133 billion. This compounds the selling that the market has already been witnessing lately.
The aforementioned figures are all indicative of sideways movement for the king coin. However, if these numbers change for good, Bitcoin might go up again as it did back in November-December 2020.


