If Bitcoin follows these technical patterns, the next 30 days will…

Bitcoin is at a better valuation range right now than it was a few days back. Consolidating near the $30,000 range was a tricky affair, but its current sideways movement near $40,000 has been openly welcomed by the community. While the cryptocurrency is still attempting to establish a proper bullish trend, it might be interesting to take a look at technical patterns to draw parallels with past movements.
Candlestick patterns – Oldest trick in the book?
Candlestick patterns are readings that are universally adopted by all traders. Their importance has been evident in forex, commodities, stocks, and now, cryptos as well.
Technical analyses and by extension, candlestick patterns, are the subject of Ecoinometrics’ latest report. These patterns are read with the objective of identifying a rare event or trend, based on which analysis is conducted. Bitcoin, for instance, saw 10 straight green candles recently.
Now, according to data, since the 1st halving, Bitcoin has registered 10-day green candles only 6 times before last week. While 2 or 3 day-candles are very common, it gets rarer from 5-days in a row. A 10-day green candle is extremely rare. Historical data also suggests that there is a certain bullishness attached to such events.
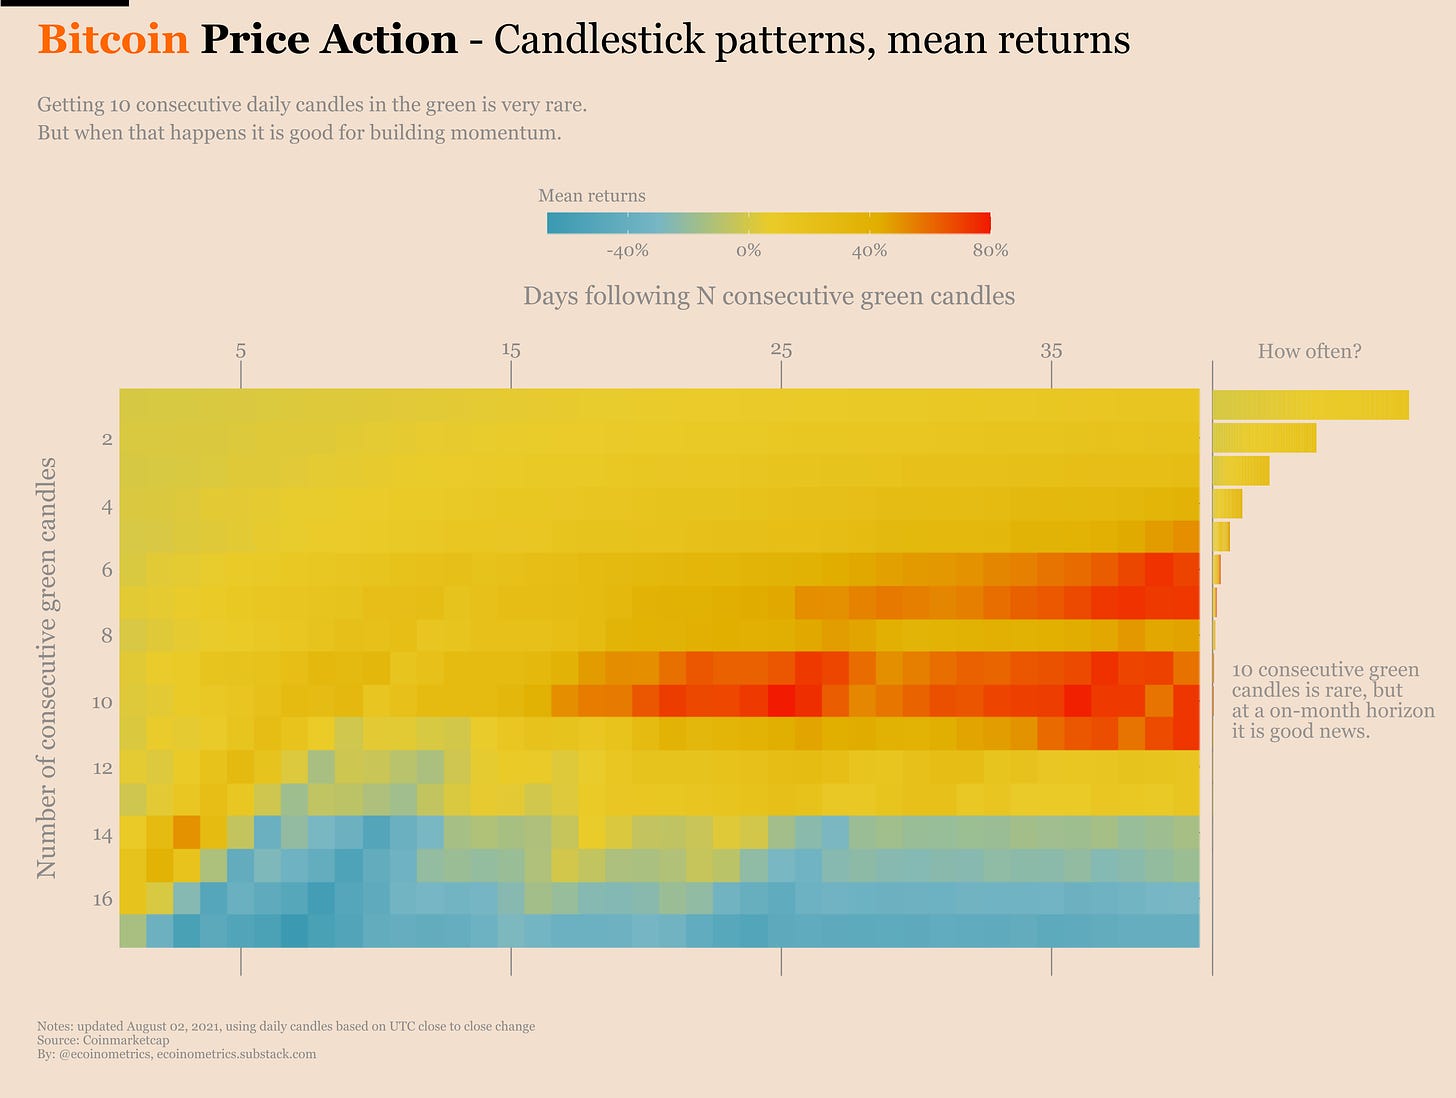
Whenever Bitcoin has recorded a 10-day green candle, 80% of the time, outsized growth has been observed over the next month or so. If indeed a 50% breakout does happen by the end of August or the start of September, BTC will be close to the ATH range yet again ($60,000-$64,000).
However, there is another important pattern that might actually pan out by tomorrow.
Red is also evident for Bitcoin
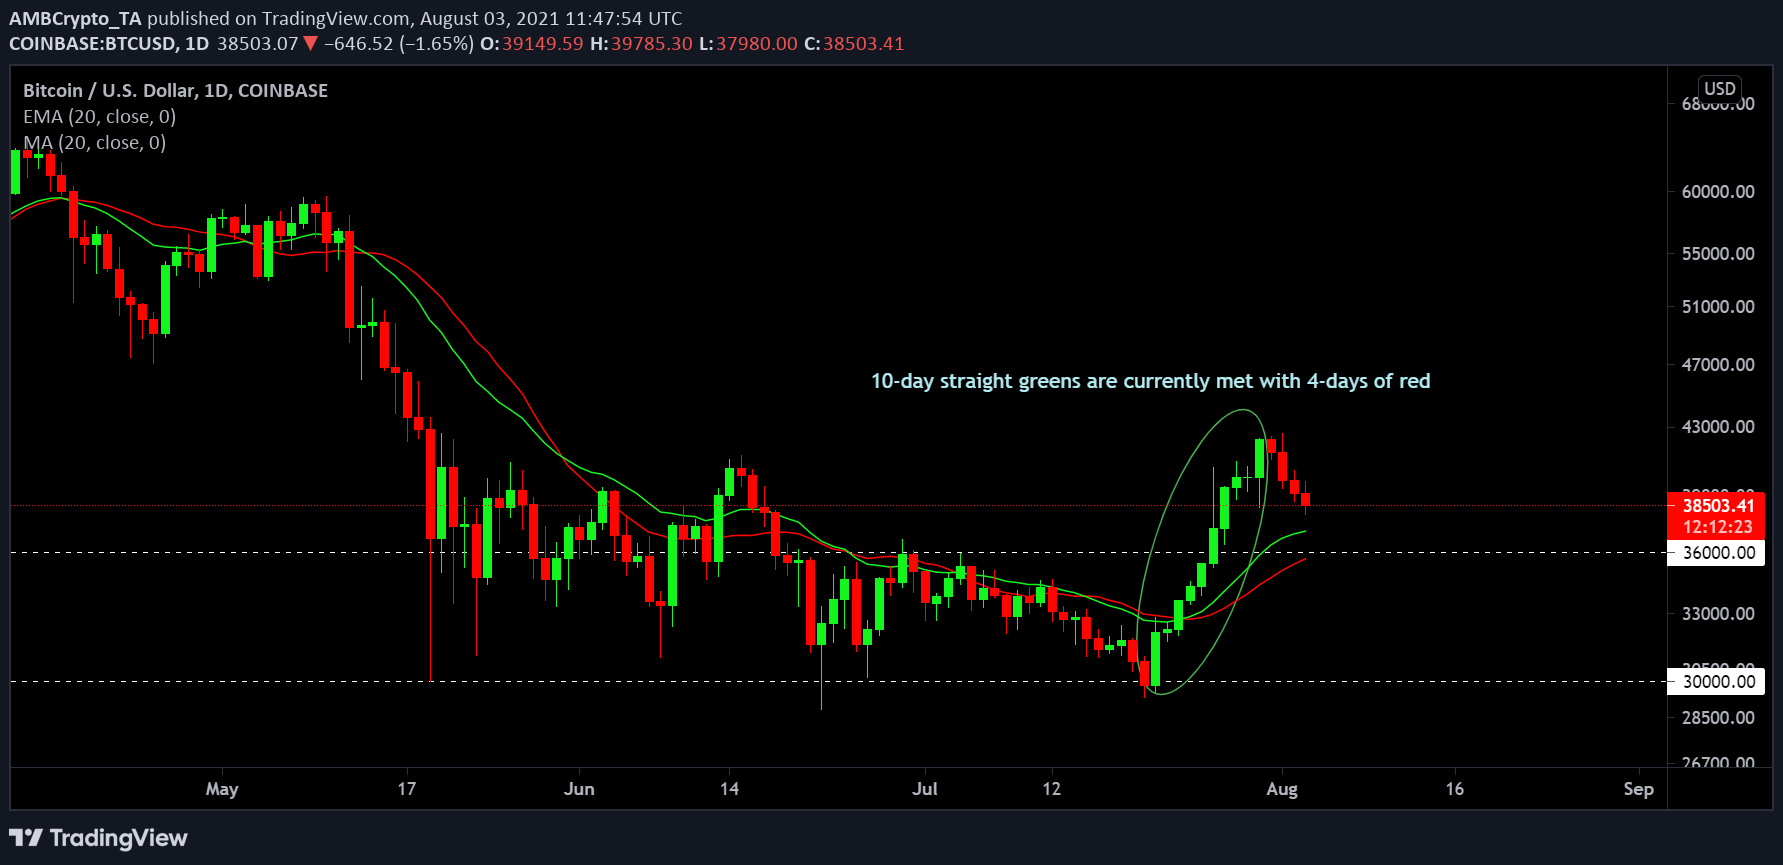
Now, just like a 10-day green is historically positive, 5-day reds have a bad history of depreciation. At the moment, Bitcoin might be locking in a 4-day red on the daily chart. A 5th red candle will, once again, be another rare event. One that might have bearish tidings for the market.
5-day reds have historically been met with strong value drop-offs, but the size of the bar has also played a major factor in the same.
What to expect in the next 30 days
We are looking at both bullish and bearish signals on the daily chart right now. By and large, however, the bullish shift should prevail. Alas, the trend is still far from definite, and amidst such a market structure, nothing should surprise traders anymore.