If this is true, Bitcoin could fall to $40,000 again

- BTC was down by over 2% in the last 24 hours while miners sold their holdings.
- Most market indicators also remained bearish on the king of cryptos.
Bitcoin’s [BTC] price has once again witnessed a correction as its daily chart turned red. This happened while the king of crypto’s price was moving in a parallel channel. If the downturn continues, BTC’s price might soon plummet to the $40,000 mark before rebounding.
Bitcoin bleeds again
After a month-long steady price movement, the king of cryptos once again fell victim to a correction in the recent past. According to CoinMarketCap, BTC’s price was down by more than 2% in the last 24 hours alone.
At the time of writing, it was trading at $42,332.07 with a market capitalization of over $828 billion. While the coin’s price dropped, Ali, a popular crypto analyst, pointed out that BTC was moving in a parallel channel on its 4-hour chart.
In the 4-hour chart, #Bitcoin is consolidating within a parallel channel, which puts all the focus on the $42,400 support.
A sustained drop below could see $BTC head to $40,700. On the flip side, a rebound from here might set the stage for an upswing toward $44,400. pic.twitter.com/P4f6C97cvL
— Ali (@ali_charts) December 26, 2023
As per the tweet, BTC’s value was resting at a key support level at the $42,400 mark. Now that the coin failed to test that support level and fell below it, the possibility of a continued downturn seemed likely.
In fact, if the data is to be believed, Bitcoin might plummet to $40,000 again before the year ends. Nonetheless, the good part was that after touching $40,000, BTC might initiate a bull rally, allowing it to hit $44,000.
Is a further downtrend possible?
To check the viability of BTC touching $40,000, AMBCrypto had a closer look at Bitcoin’s on-chain metrics. Our analysis found that BTC’s aSORP turned red, meaning that more investors were selling at profits.
As per our look at CryptoQuant’s data, BTC’s Miners Position Index (MPI) also flagged the same red color. This clearly meant that miners were selling more holdings compared to its one-year average, which had the potential to push the coin’s price further down.
However, it was interesting to see that despite the MPI and aSORP being red, both Bitcoin’s exchange reserve and exchange netflow remained green.
Whenever these metrics turn green, it suggests that buying pressure on a token is high, which can be perceived as a bullish signal.
Read Bitcoin’s [BTC] Price Prediction 2023-24
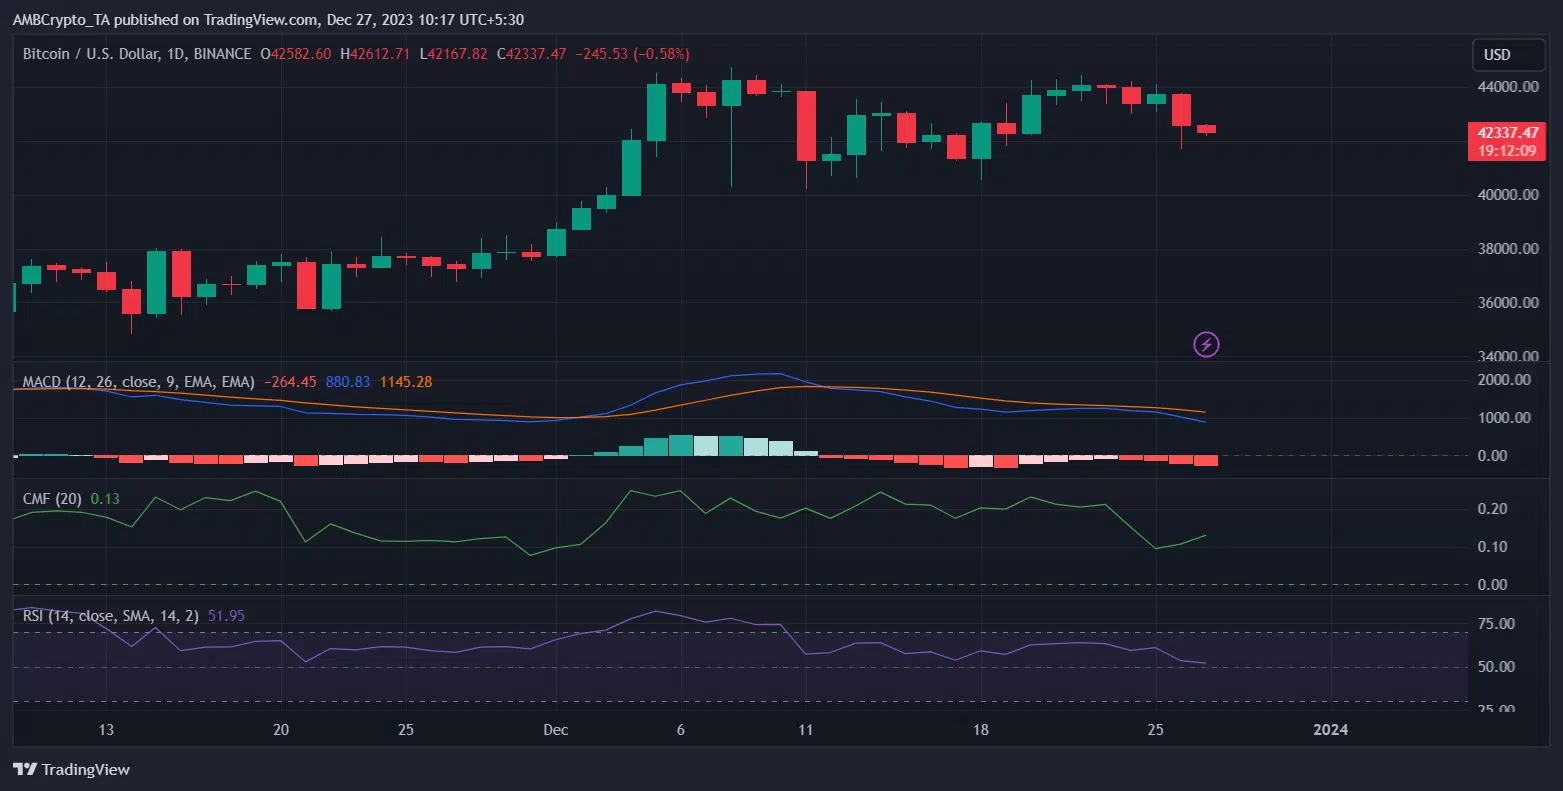
AMBCrypto then had a look at BTC’s daily chart and found that the sellers were leading the market as its MACD displayed a bearish crossover.
Bitcoin’s Relative Strength Index (RSI) registered a downtick, suggesting a continued price decline. Nonetheless, the Chaikin Money Flow (CMF) remained optimistic as it moved northward.


