
With sudden bullish volatility hitting the market, bitcoin has managed to surpass $50k once again, while the rest of the altcoin market breaks away from the bearish trap. However, how does the long-term future of some altcoins like IOTA, Litecoin [LTC], and Polkadot [DOT] look?
IOTA
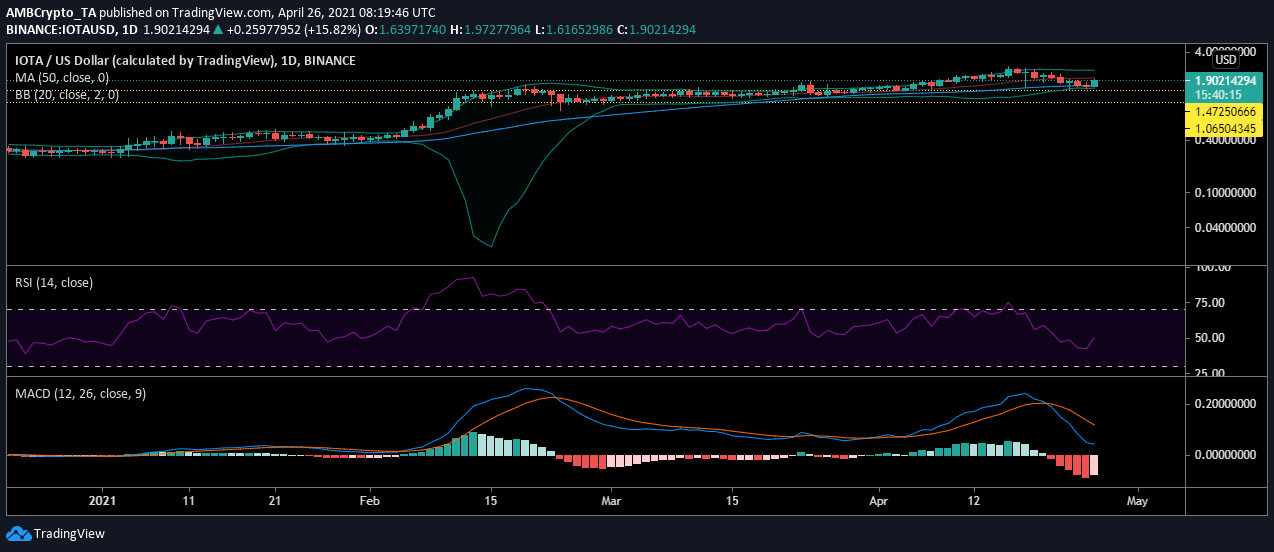
Source: IOTAUSD on TradingView
IOTA chart noted that the price of the digital asset registered an upsurge from mid-March, but began consolidating in April. Despite volatility observed in the remaining altcoin market, IOTA more or less withstood it and was trading at a historically high value of $1.90, at press time.
Meanwhile, the market seemed to be gearing up for more buying pressure as the relative strength index was rising from the oversold zone. This spike indicated that there was a rise in buying pressure in the IOTA market and the digital asset could be heading towards a trend reversal.
Litecoin [LTC]
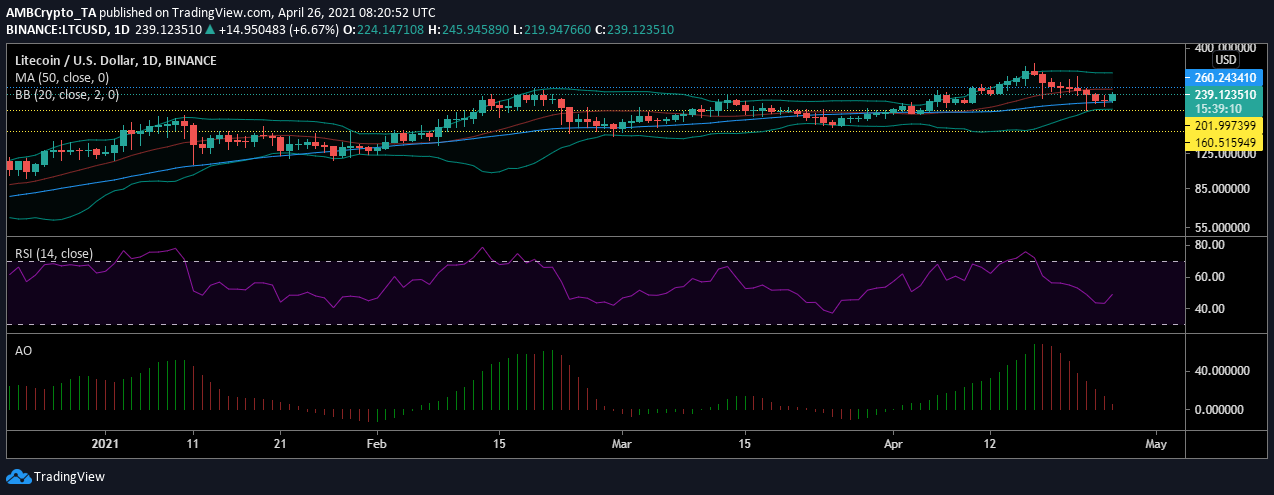
Source: LTCUSD on TradingView
The Litecoin price was dwindling at the support level of $201 but Bitcoin’s sudden shift in movement sent LTC to $243, at the time of press. As LTC moves forward, continued support from the buyers could push the asset to test resistance at $260. However, with the momentum siding by the buyers currently, it may take a while.
Bollinger bands indicated volatility in the market, however, the traders were holding onto the current level. This was suggested by the relative strength index which was currently at an equilibrium. Since buying and the selling pressures were equal, LTC may continue at this level in the short term.
Polkadot [DOT]
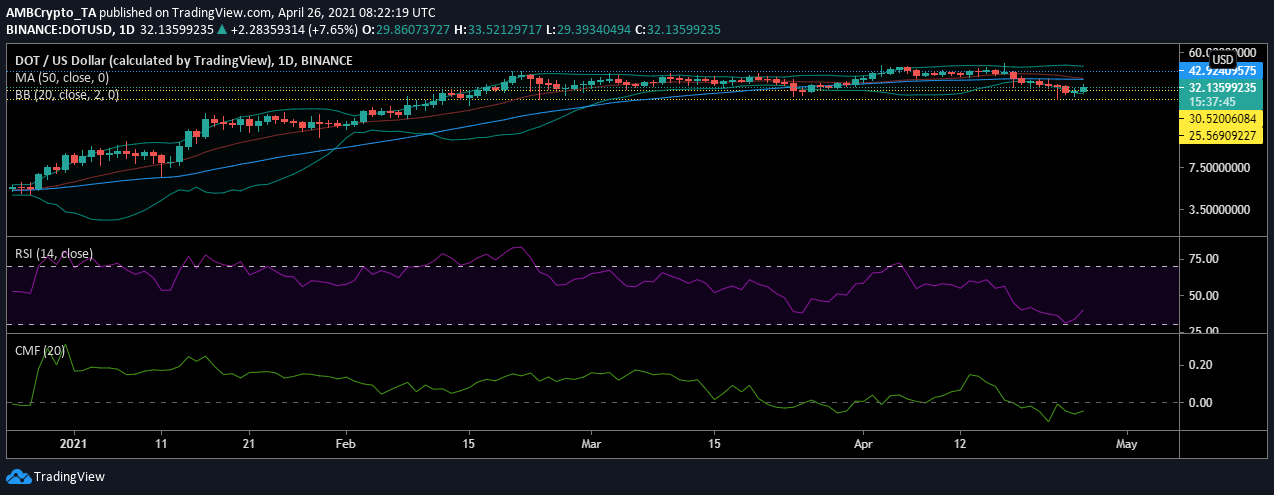
Source: DOTUSD on TradingView
After witnessing tremendous growth in 2021, Polkadot [DOT] token was still holding to a high value. Although the market did not show a drastic change in price due to volatility, the current indicators point at a descent.
DOT was trading at $32.13 with the signal line and the 50 moving average above it. Even with the recent boost in value, DOT was still able to reverse the bearishness. Relative Strength Index suggested that the boost pushed DOT away from the oversold zone and currently, the buying pressure was on the rise. The asset may witness a trend reversal as it moves to surpass the resistance at $37.
Meanwhile, Chaikin Money Flow noted that the sell-off caused the money to increasingly flow out of the market. However, the current influx of buyers was pushing this indicator towards the positive.