Is Bitcoin back to $56,000 a real threat

Disclaimer: The findings of the following analysis are the sole opinions of the writer and should not be taken as investment advice
Bitcoin’s trajectory heading into November has certainly fallen short of expectations so far. While Bitcoin went north of $66k in late October, the past couple of weeks have not bared much fruit for the world’s largest altcoin. Its weekly ROI, at press time, sat at a bleak 1.7% as alts such as Solana, DOT and BNB continued to witness inflows.
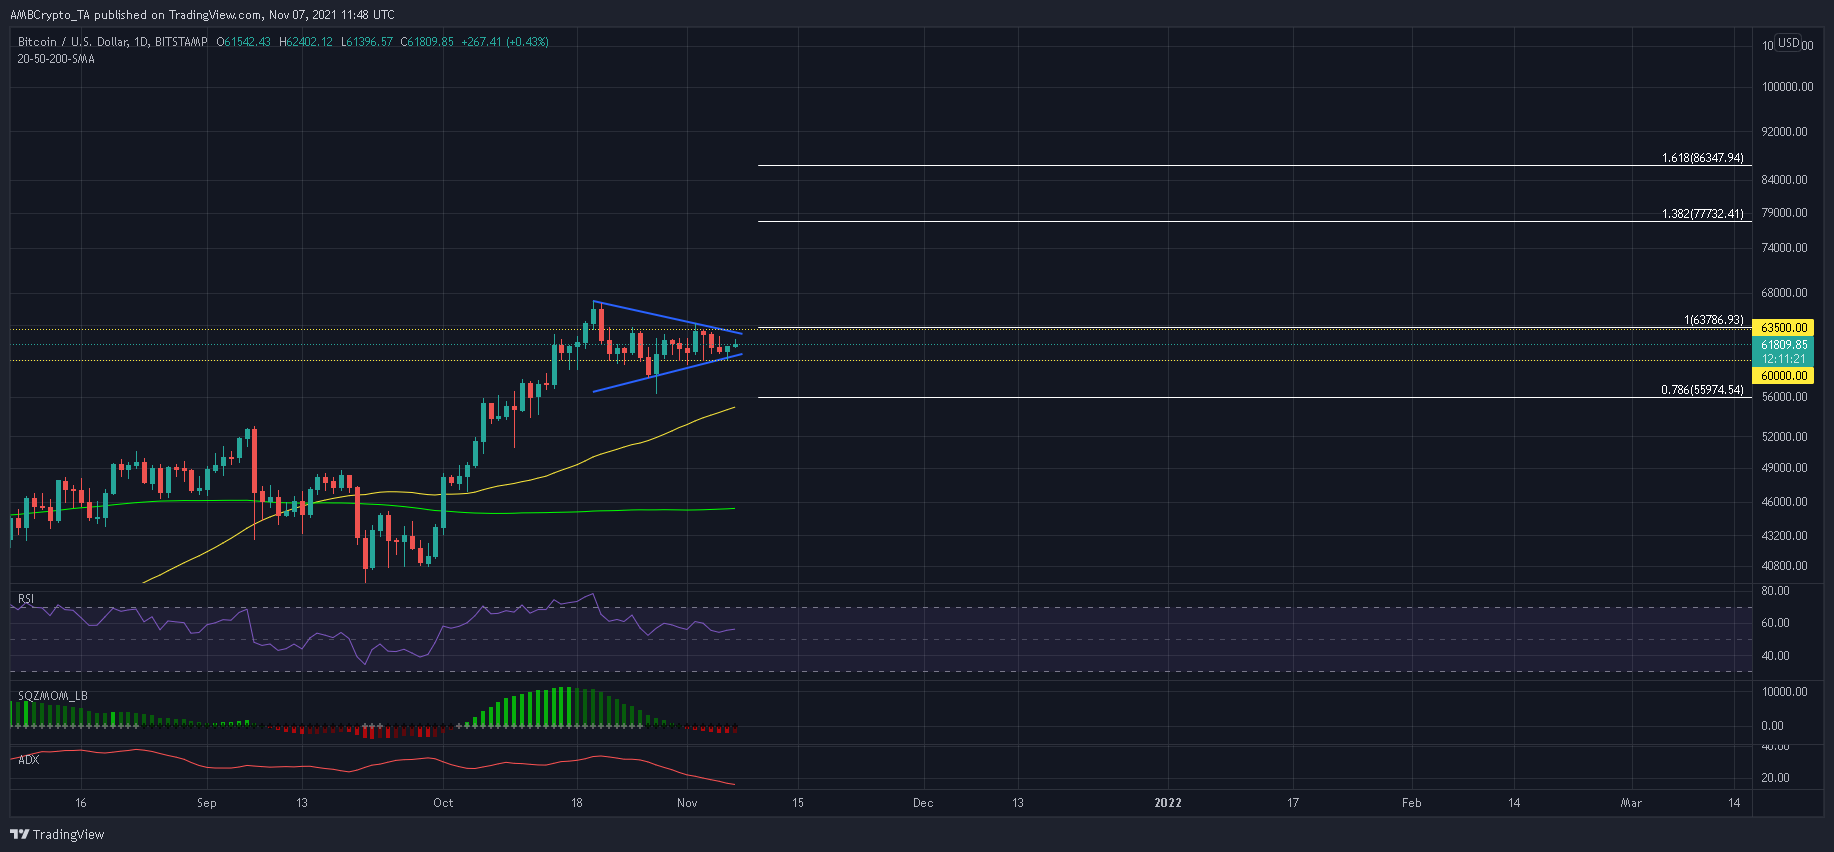
A closer look at its daily chart did suggest a symmetrical triangle formation and a possible forthcoming price swing. But, a move in either direction also seemed quite possible.
Should its RSI, Squeeze Momentum Indicator, and DMI continue on their bearish path, BTC would likely revisit $56k on the back of a downwards breakout. At the time of writing, BTC was trading at $61,809, up by 2% over the last 24 hours.
Bitcoin Daily Chart
Following a 70% pickup in October, Bitcoin seemed to be forming a symmetrical triangle after snapping two lower highs and two higher lows. Now, considering a weak directional trend according to an ADX reading of 15, BTC would continue its near-term lateral movement over the near term.
Immediate resistance and support levels of $63,000 and $61,000, respectively, would contain BTC as the symmetrical triangle extends shape. Should BTC gather strength for a move above $65,000, bulls can march forward towards the 138.2% and 161.8% Fibonacci levels after negotiating past a double top at $66,664.
In case BTC weakens below $60,000 at any given point, bears could find momentum to initiate further drawdowns. The next viable defenses were at $59,000, $57,275, and $56,425. A close below the 50-SMA (yellow) would spell further danger for bullish traders.
Now, Bitcoin’s daily RSI has declined for a period of three weeks. At the time of writing, it sat slightly above the half-line. While a neutral bias is maintained, short-sellers can quickly jump on board if the RSI weakens below 45. In fact, momentum was already with the sellers, according to the Squeeze Momentum Indicator’s bearish reading.
Conclusion
Although it is too early to call for a breakout prediction, market observers have to be vigilant over the coming days. In case Bitcoin weakens below $60,000 on the back of a weak RSI and SMI, a sell-off could drag BTC below the 78.6% Fibonacci level before the next upcycle hits the market.


