Is BNB’s confidence in its best performers enough to reverse its downtrend

- BNB Chain was quite heated due to multiple positive developments
- BNB’s stochastic was oversold, but the rest of the metrics were negative
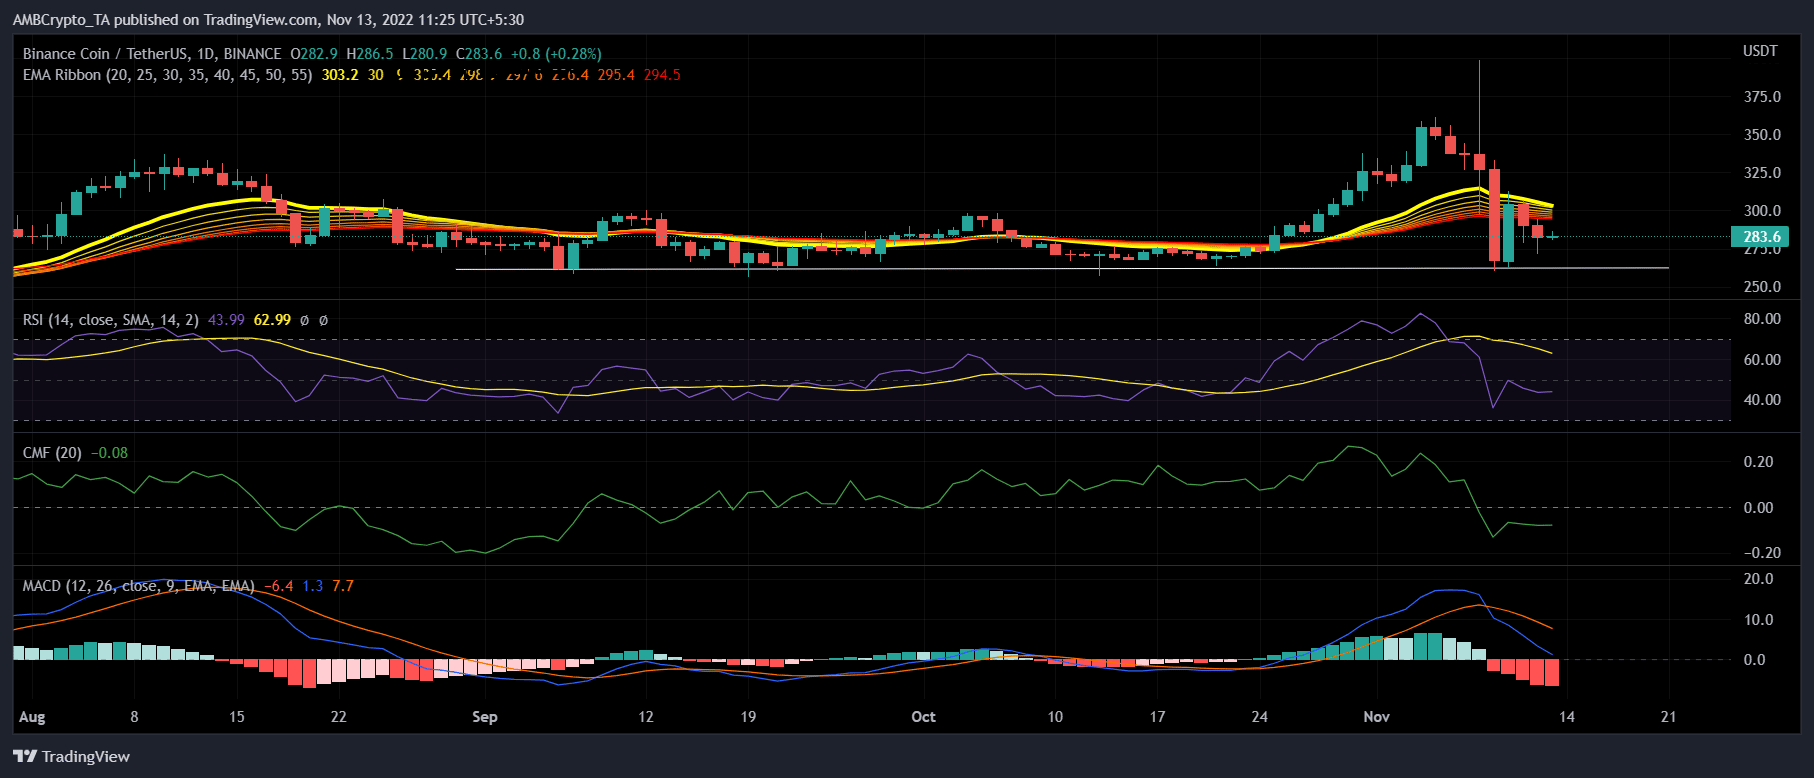
BNB’s performance last week was not what investors expected. Its price went down considerably, like most other cryptos in the market. The credit for this price decline goes to the current market, which favors the sellers.
According to CoinMarketCap, BNB registered a 19% decline in the last week. At press time, it was trading at $284.02, with a market capitalization of $45.49 billion.
Read BNB Chain’s [BNB] price prediction 2023-2024
Despite this, BNB, in a recent tweet, stated,
“No matter what happens, one thing you can rely on is our October Stars continuing to make solid progress.”
No matter what happens, one thing you can rely on is our October Stars continuing to make solid progress 💫
@Quest3_xyz, @bobanetwork, @xdaoapp and @PythNetwork continued reaching new milestones this week.
Get the details ⤵️ pic.twitter.com/XARdZ3O2H2
— BNB Chain (@BNBCHAIN) November 12, 2022
As per the tweet, several positive developments took place on the BNB chain that looked pretty promising for the blockchain. For instance, Boba Network was nominated for the AIBC summit blockchain of the year 2022 award, while Pyth Network was set to release a CAKE/USD price feed. Additionally, Quest3 had over 18,000 weekly active users on the BNB chain.
BNB was also among the list of the most voted coins on CoinGecko on 12 November, which was positive news for the coin.
⚡️Most Voted Coins by @CoinGecko
12 November 2022#Bitcoin #BTC $BTC #Ethereum #ETH $ETH #BNBChain #BNB $BNB #TRON #TRX $TRX #Cardano $ADA $DOGE #Litecoin $LTC #Chainlink $LINK #Monero $XMR #Stellar $XLM #XLM pic.twitter.com/pJfZSJk3C5— CryptoDep (@Crypto_Dep) November 12, 2022
This is worth considering
Before speculating that these updates might positively impact BNB’s price, let’s look at BNB’s metrics to better understand the scenario. At the time of writing, BNB had registered an uptick as its price went up over 3% in the last 24 hours. However, the on-chain metrics were still didn’t favor investors.
BNB’s daily transactions in profit went down sharply after a spike on 8 November. The velocity also took the same path and declined in the past few days, which was yet another bearish signal. Furthermore, BNB’s Market Value to Realized Value (MVRV) ratio also registered a downtick, further increasing the chances of a price decline.

However, CryptoQuant’s data gave a slight ray of hope to investors as it revealed a major bullish signal. BNB’s stochastic was in an oversold position, thus acknowledging the possibility of a northbound breakout soon.
Market indicators in support of BNB?
Market indicators for BNB painted a bearish picture, as they supported the sellers. BNB’s Relative Strength Index (RSI) and Chaikin Money Flow (CMF) were both resting below the neutral position, a negative signal for the blockchain. The Moving Average Convergence Divergence (MACD) also displayed a bearish crossover, increasing the chances of a price plummet.
The Exponential Moving Average (EMA) Ribbon was in the bulls’ favor, as the 20-day EMA was above the 55-day EMA. However, the distance between them kept decreasing, which might cause a bearish crossover soon.