Is BTC hitting this 2020 metric a sign of an upcoming bull run? Decoding…

- Addresses holding 10 – 1000 BTC soared in recent months, hitting 2020 levels for the first time
- There are similarities in the price level of BTC observed in 2020 and 2022
The number of individuals who own 10 – 1000 Bitcoin [BTC] increased significantly in recent months. BTC also showed some volatility, mostly due to events surrounding the cryptocurrency industry.
Some observers declared that Bitcoin and cryptocurrencies were ‘dead’ due to price volatility. Judging from this metric, BTC was likely gaining more users.
Read Bitcoin’s [BTC] Price Prediction 2023-2024
Similarity and possible reasons for the increase
Santiment reported a dramatic surge in the number of Bitcoin addresses holding 10 – 1000 BTC as of 11 December. According to the data, the addresses rose to almost 151,000, a number that was last seen in 2020. The chart also revealed a precipitous decline following 2020’s peak.
?? There are now 151,080 addresses that hold between 10 to 1,000 $BTC. After a massive decline that began in December, 2020, these addresses have increased significantly throughout 2022 as #Bitcoin has progressively become more affordable. https://t.co/5rdAno5SKy pic.twitter.com/uahECloHyR
— Santiment (@santimentfeed) December 11, 2022
The similarity in BTC’s price at each stage was an interesting observation that could also be made from Santiment’s chart. The price of BTC was roughly $18-19k in 2020 when the number of addresses was approximately at the same level as it is now. BTC is currently valued at about $17,000. Is there a reason for this corresponding growth?
The similarities could be explained by taking a closer look at the chart. The most significant factor would be an anticipated increase in the value of Bitcoin. There was a decrease in holdings, which occurred at the same time that the price of BTC increased.
Investors who purchased at a lower price sold their assets when the price rose. This could suggest that the current address increase was a precursor to an anticipated BTC bull run.
Bitcoin in the daily timeframe
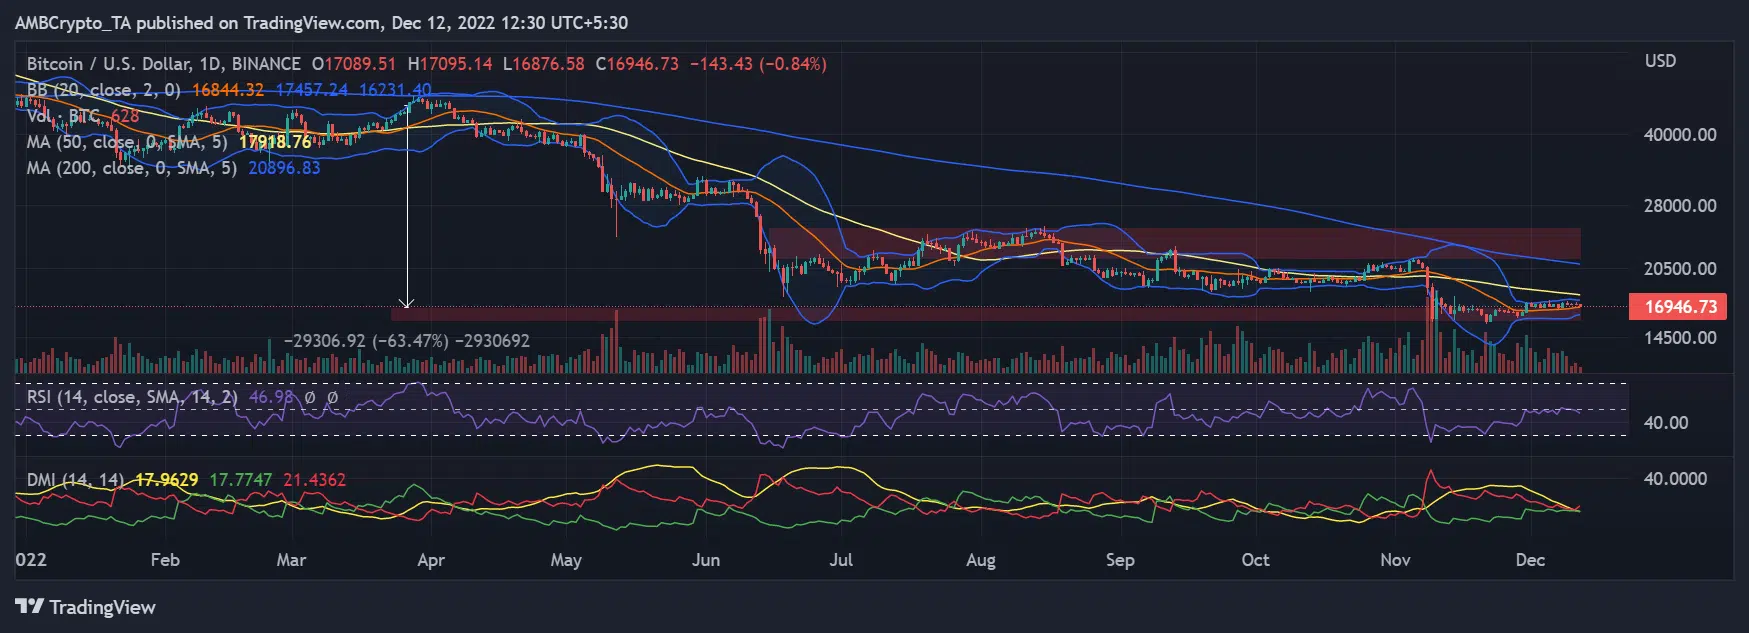
Bitcoin [BTC] was trading at over $45,000 in late March and early April 2022, according to the daily timeframe. It was, however, trading for about $16,900 at the time of writing, pointing to an obvious massive decline. Plotting the price range revealed that the asset had declined by 60% in the time frame.
The short Moving Average (yellow line) on the price chart also served as resistance. With the yellow line in its current location, the initial observed resistance was around $18,000. In the long-term, however, the resistance observed was between $21,000 and $25,000.
While there have been no obvious higher highs in the current price movement, a breach of the current resistance levels could spark a BTC rally. Once the bull run begins, its price could rise to where it was before, around $40,000, and even higher.
Additionally, the Bollinger Bands (BB) shrank, indicating less price volatility for BTC. The contraction could, however, also be a sign of impending volatility.
Upcoming events that could impact BTC
These forthcoming events may affect the price of BTC due to the correlation between traditional markets and its price movement in the past. The Consumer Price Index for November will be revealed on 13 December; the next day, the Federal Reserve will announce its current interest rate.
Though it is assumed that the total number of addresses may change, the effects of these occurrences still need to be discovered.


![Decentraland [MANA] vs FET - Active addresses, dev. activity, and more](https://ambcrypto.com/wp-content/uploads/2025/01/MANA-Featured-400x240.webp)


