Is Lido’s position at risk? What rising ETH withdrawals suggest
LDO poised for further losses as the bears overpower the bulls.

- Lido’s market dominance has fallen to its lowest in the last year.
- The protocol has seen a significant uptick in withdrawals.
The market share of liquid staking protocol Lido Finance [LDO] in the Ether staking market has plummeted to a one-year low.
According to a Dune Analytics dashboard, the share of ETH deposited to the beacon chain through Lido middleware was at 29.1% at press time. The last time it was under 30% was in February 2023.
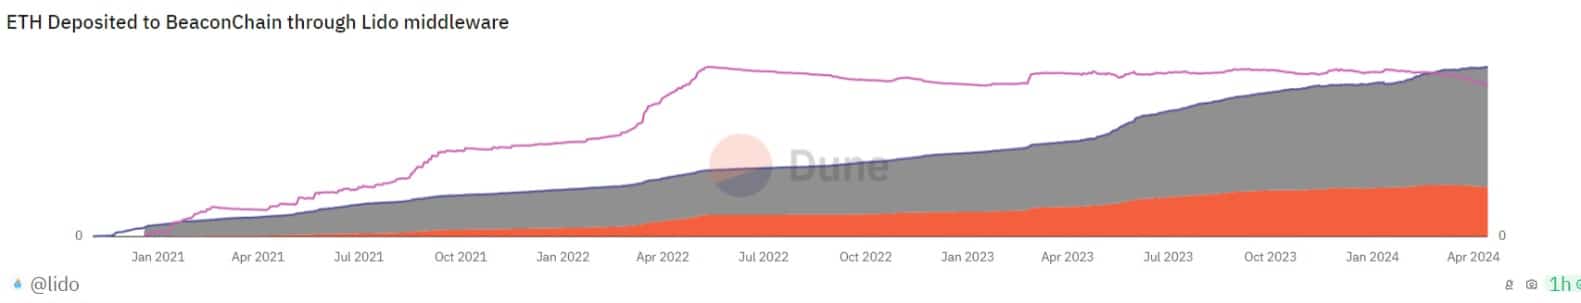
On a year-to-date (YTD) basis, Lido’s market share has dropped by 8%. This decline is due to a spike in withdrawals from the liquid-staking protocol in the last month.
On-chain data from Dune Analytics showed that since 12th March, withdrawals from Lido have exceeded the deposits made through the protocol.
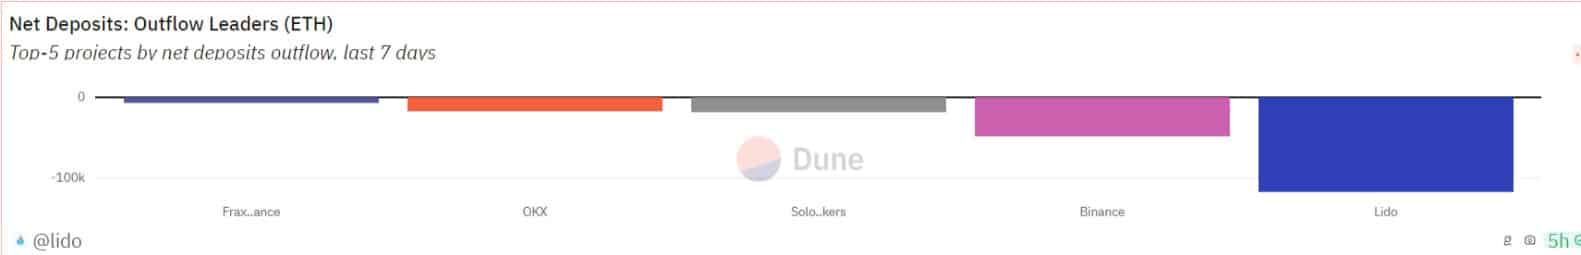
Ranking as the staking platform with the most outflows in the last week, withdrawals from Lido have totaled 117,000 ETH at press time, valued at 35.69 million USD.
Lido has witnessed a spike in withdrawals as the Annual Percentage Rate (APR) offered to users staking on the platform has dropped.
As of the 10th of April, the user APR assessed on a seven-day moving average was 3.28%, having declined by 14% since the 11th of March.
What you should expect from LDO
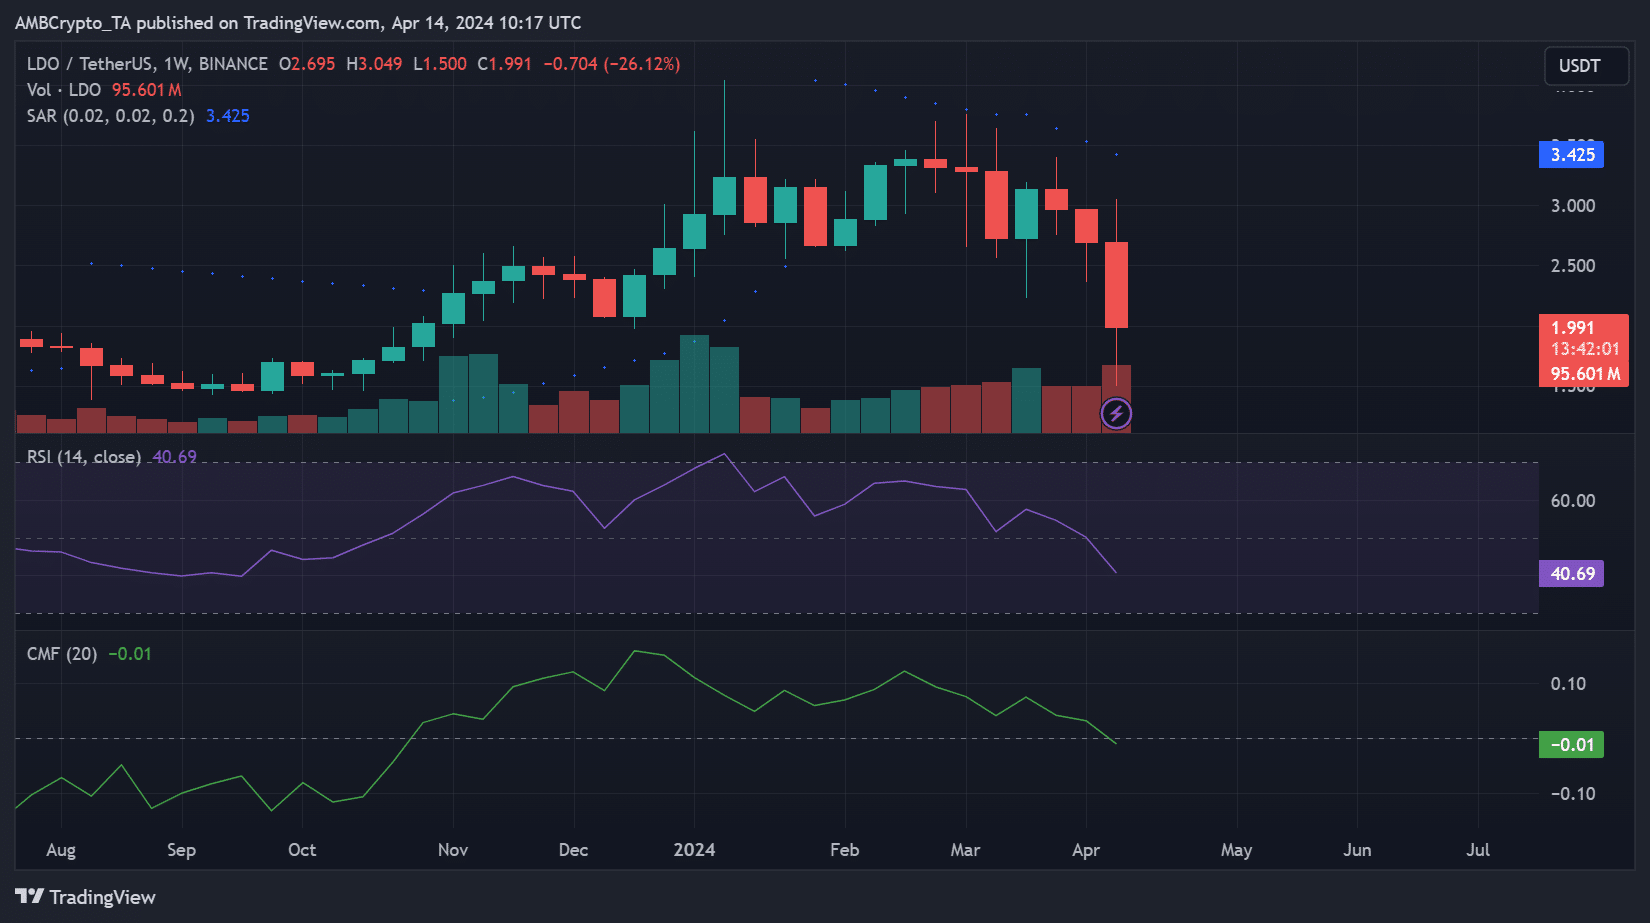
At press time, the protocol’s native token LDO exchanged hands at $2.61. In the last month, its value has dropped by over 20%, according to CoinMarketCap’s data.
Its performance on a weekly chart hinted at the possibility of a further decline in the midterm.
Its Chaikin Money Flow (CMF), which measures the flow of money into and out of the asset, had breached the zero line at press time and was poised to trend downward.
A CMF value below zero is a sign of market weakness. It suggests a rally in liquidity outflow from the market and a spike in selling pressure.
Confirming the hike in LDO distribution, its Relative Strength Index (RSI) was 40.69 and further declining at the time of writing.
This RSI value showed that market participants preferred to sell their LDO holdings rather than accumulate more tokens.
Further, the dotted lines of LDO’s Parabolic SAR indicator rested above its price at press time.
Realistic or not, here’s LDO’s market cap in BTC’s terms
This indicator measures the potential reversal points in an asset’s price direction. When its dotted lines rest above an asset’s price, it is a bearish signal.
It confirms that an asset’s price is in decline, and the fall will continue if sentiment remains the same.


