Is Litecoin headed back toward $120 after failure to breach $150

Litecoin has struggled to break past the $163 level for the whole of December after the early December sell-off saw Litecoin drop from $200 to $140. At the time of writing, the market structure continued to be bearish. Even though Bitcoin was trading just above an area of support and could see a decent bounce if the support level was defended, Litecoin did not show any signs of a possible, partial recovery.
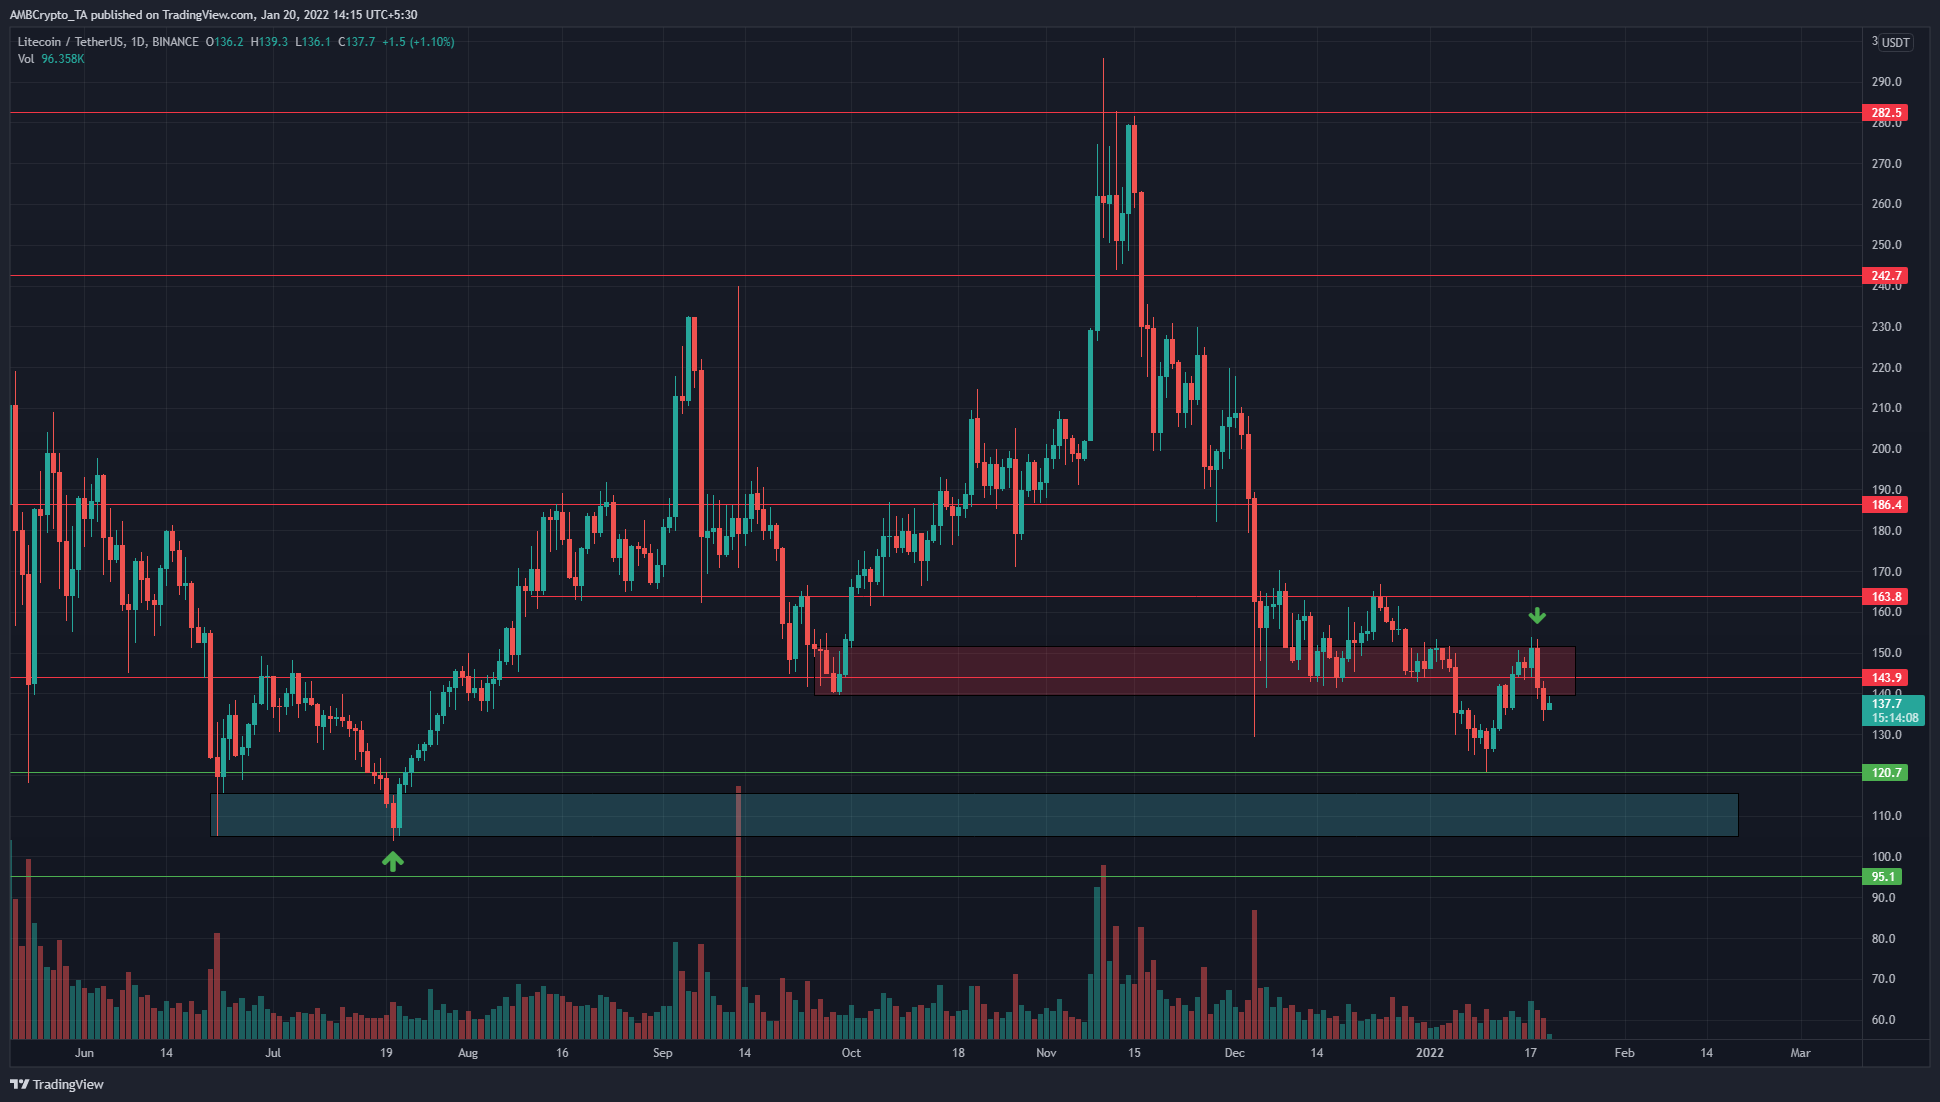
The $140 area (red box) has been a liquidity pocket where bulls and bears have skirmished for control. In September, this area saw Litecoin rally strongly and climb to $282. In the past few weeks, this same area saw Litecoin bounce feebly off it. There appeared to be no demand and lots of supply.
Emboldened bears have flipped this area from demand to supply. The green arrow on the chart showed that, a couple of days ago, a bearish engulfing candlestick was seen on the daily chart. This signified a bearish order block, a significant area of supply.
After this definitive rejection, it was likely that Litecoin would drop further south. The $120 level of support, and the $110 area of demand (green) could see a bullish reaction. However, this reaction (bounce) would need to flip $140 back to demand before conversation of a recovery can really begin.
Rationale
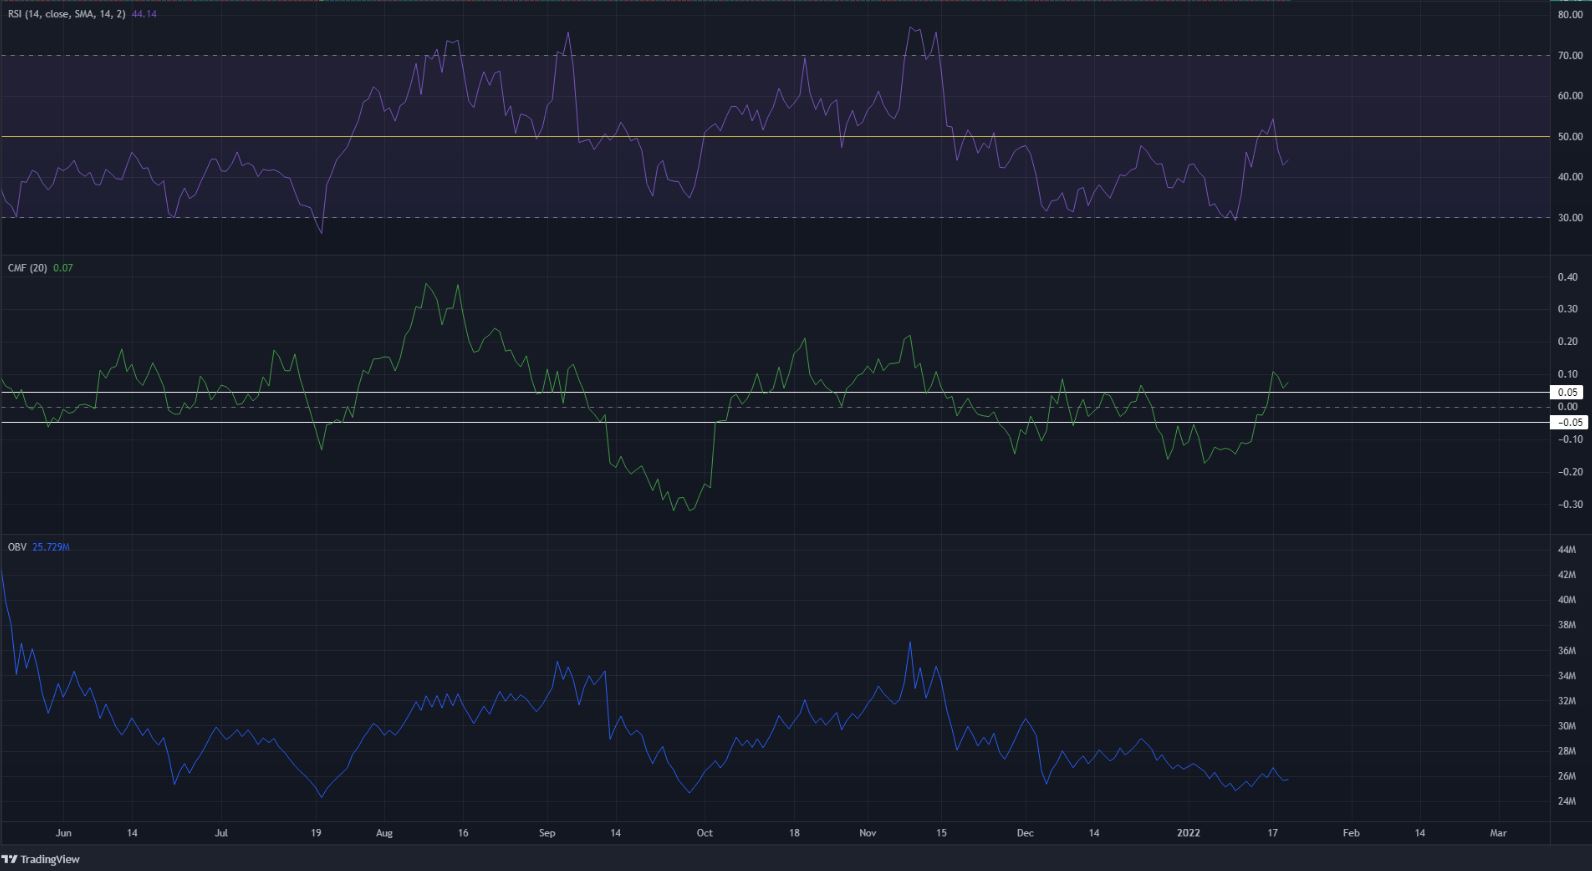
The daily RSI climbed to neutral 50 in recent days and was rejected there, a sign of bearish momentum climbing. Moreover, the inability of the RSI to climb above neutral 50 showed that a bearish trend was in progress.
The CMF was above +0.05, which showed strength from buyers. This was in disagreement with the bearish findings presented. One explanation is that, as a lagging indicator, the CMF was reacting to the bounce from $120 for LTC, and could head back below +0.05 soon.
The OBV was also in a downtrend in recent weeks.
Conclusion
The price action showed a bearish order block established in the $140 region and marked it as a crucial area for bulls to overcome. An impulse move south can be expected from here for the next few days/couple of weeks.