Is Shiba Inu’s ‘James Bond’ role outshining other altcoins

‘Car chases, stunts, pretty girls, megalomania, spectacular explosions, and a far-fetched plot’- Doesn’t it sound like a perfect SHIB movie? Well, yes, because metaphorically, James Bond films and Shiba Inu’s correlation can’t be nullified.
The joke token has been ruling the minds of investors thanks to the newly introduced Metaverse experience. Notably, SHIB’s Metaverse transactions have surpassed the 4,500 mark within 24 hours into the commencement of the bid event phase. Yet the price action appeared cold on the chart.
Hey #ShibArmy,
🏡 Are you in a https://t.co/lshdeslSIN SHIB – The Metaverse bidding war currently? Tell us about it 👀
We just surpassed over 4500+ transactions so things are heating up, remember this event will end in less than 72 hours.
— Shiba Inu on BASE (@WagglesCG) April 13, 2022
The name’s Inu. Shiba Inu.
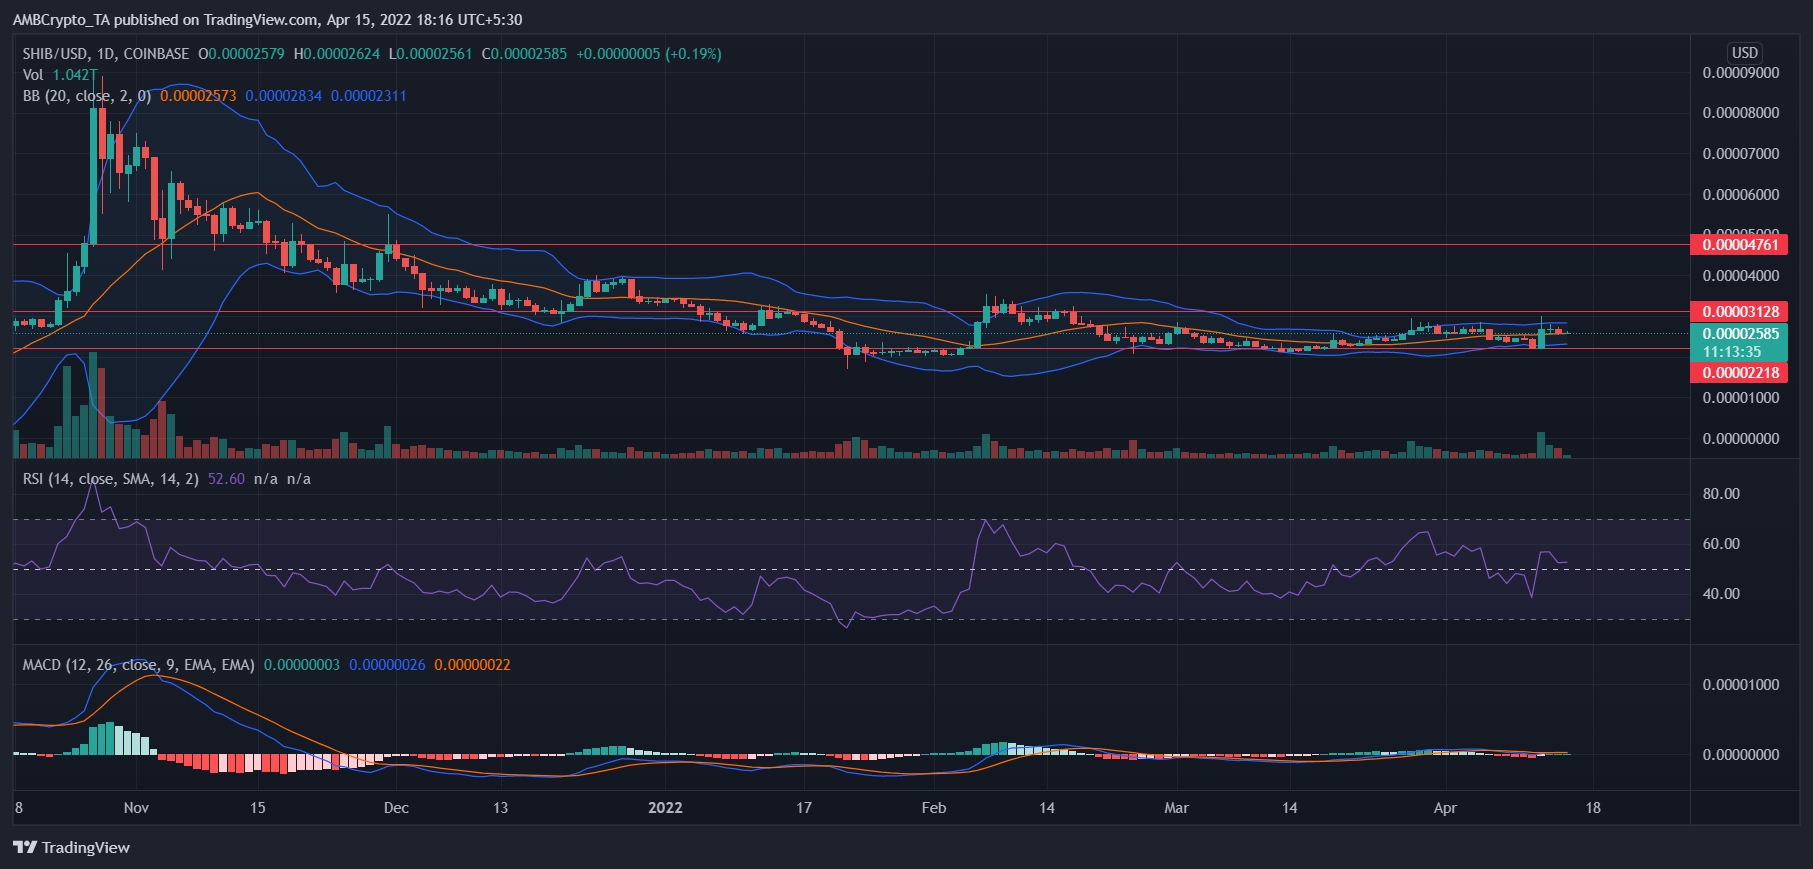
Clearly, on a downtrend, Shiba Inu has been trading within a range of $0.00003128 to $0.00002244 from 5 January, 2022. Lack of demand has been dominating the SHIB’s market for quite some time.
Considering a closer timeframe, SHIB’s move to the north will meet the testing point at $0.00004761. This would be an important milestone for SHIB holders- turning this level into support would help the meme token eye its all-time high at $0.00008703. Currently, the token is up by 47.19% from its cycle low on 22 January, 2022.
Importantly, Bollinger bands can be seen forming a squeeze since March 2022. This occurs when the price has been moving aggressively and then starts moving sideways in a tight consolidation. The current squeeze is hinting that SHIB holders, at present, shouldn’t expect much volatility from the token.
It’s interesting to note that SHIB recorded a 14.867T volume on 12 April when the price of the token appreciated a little. But, since the bulls didn’t have enough strength, SHIB couldn’t sustain the rise. Also, the volume on 13 April (the next day) shrunk to 6.965T. Well, it looks like the sellers have the upper hand in the current market structure.
Technical indicators like RSI and MACD have also been bearish for most of their sessions in 2022. While the price chart looks somber, it’s important to take a look at the metrics.
You ask, how SHIB is playing Bond’s role? Look at its far-fetched plot- The MVRV ratio (30-D) which was hovering below the zero line since 3 March 2022 jumped up to 15.36% on 30 March. And, came back to -10.65% on 11 April 2022.
However, at the time of this analysis, it was slightly above the zero line. It clearly shows that SHIB short-term holders are not in the mood to sell at a loss.

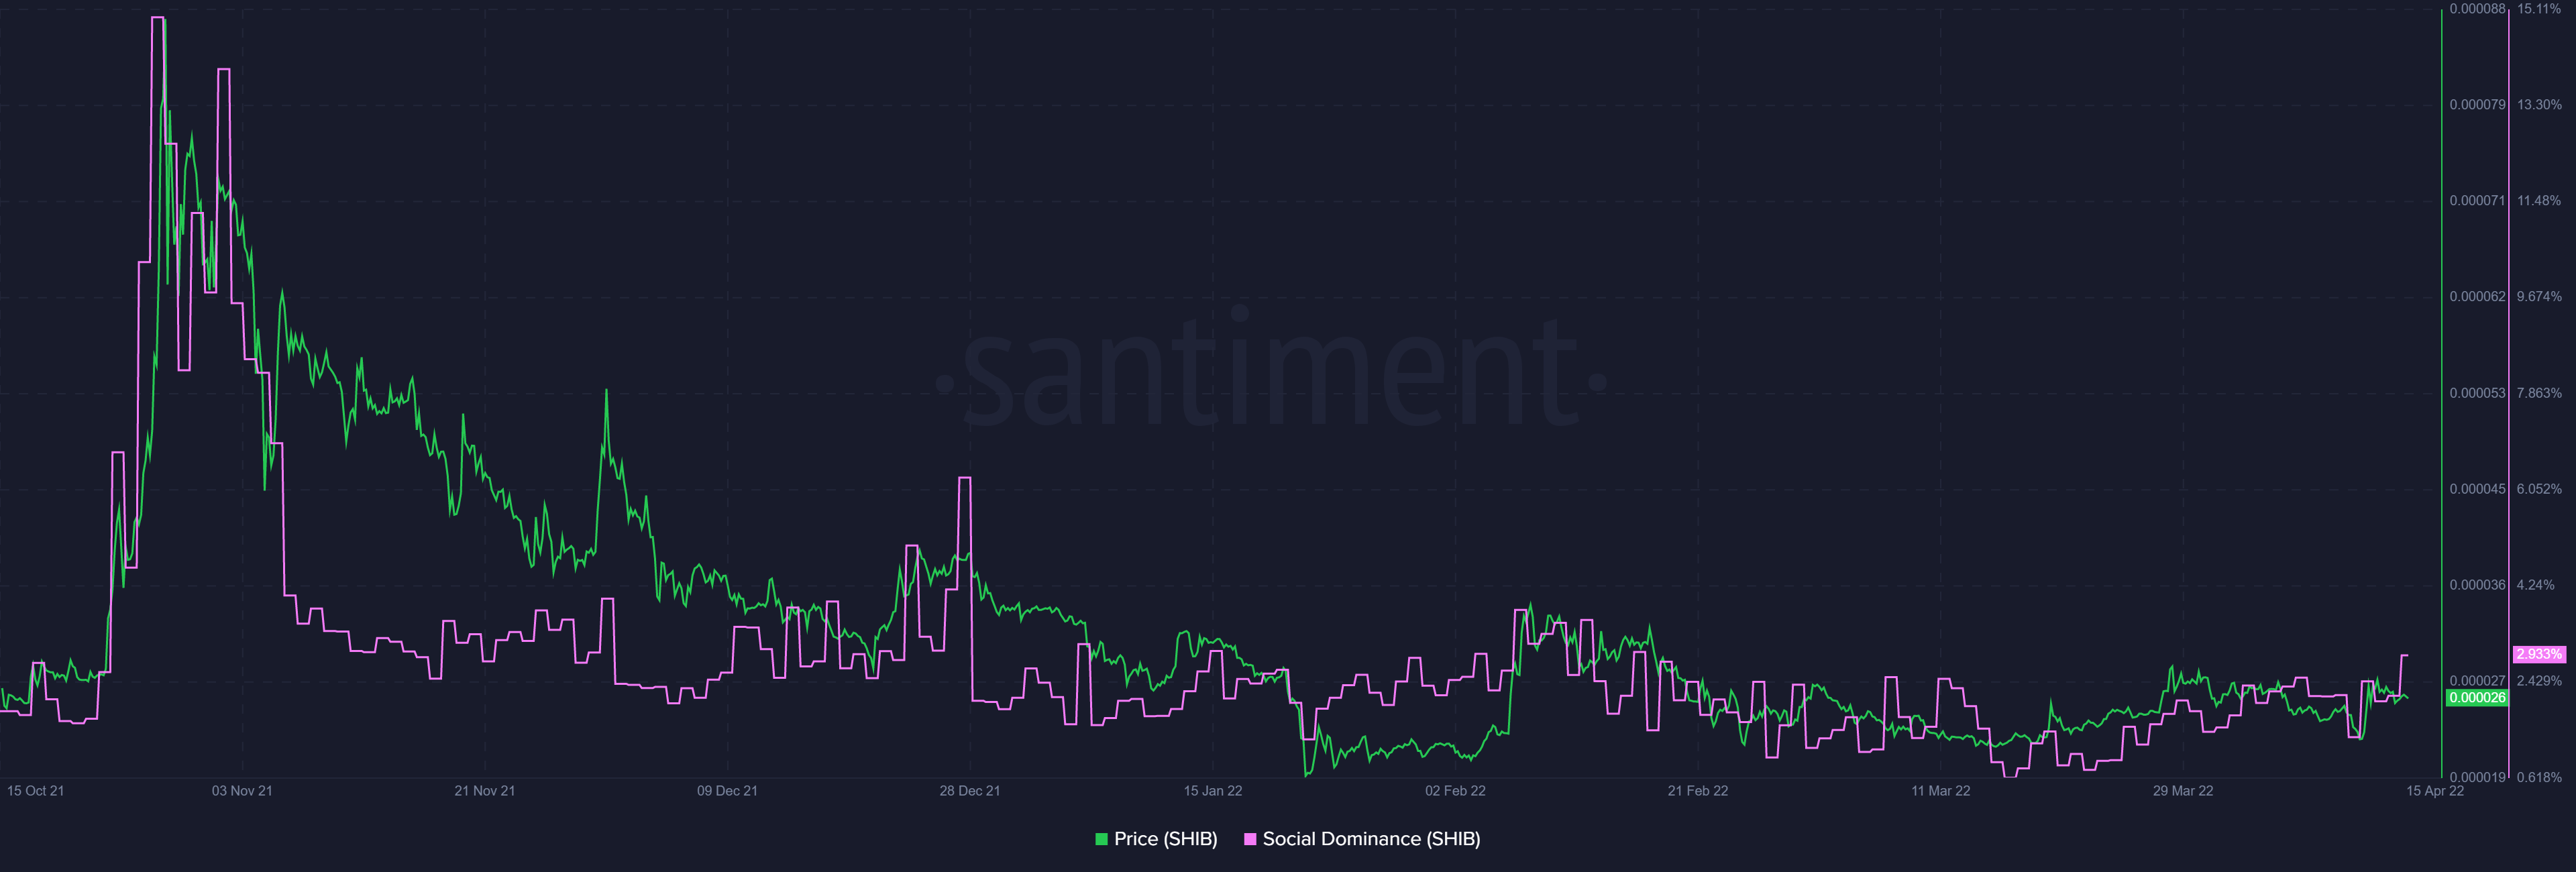
A look at SHIB’s social dominance can help traders decide if they should cut losses in the current market. The little spikes post 27 December 2021 highlight the fact that SHIB has been losing its steam.
The reading on the chart reveals that the euphoria that controlled the SHIB in 2021 seems to be gradually declining- Investors’ low confidence in the token could be one of the reasons behind it.
While SHIB may share a lot of Bond films’ characteristics, it doesn’t seem to be outshining other altcoins at the moment. In fact, it hasn’t been successful to give back a profitable rally to its investors, let alone outperforming other coins.
Investors who consider themselves wise can think twice before investing in SHIB for they might have to abandon hope and wait longer for a rally to kick in.
Disclaimer: The findings of the following analysis are the sole opinions of the writer and should not be considered investment advice.