Is the demand across Fantom’s short-term market enough

Disclaimer: The findings of this analysis are the sole opinions of the writer and should not be considered investment advice
The market structure has been bullish in the short term for Fantom. The price formed an ascending channel, but the $2-area is likely to pose some resistance to further gains.
Moreover, there is a chance that Bitcoin could see a pullback to $42,000 in the hours to come or the next couple of days. This could see a pullback for Fantom as well.
FTM- 1 hour chart
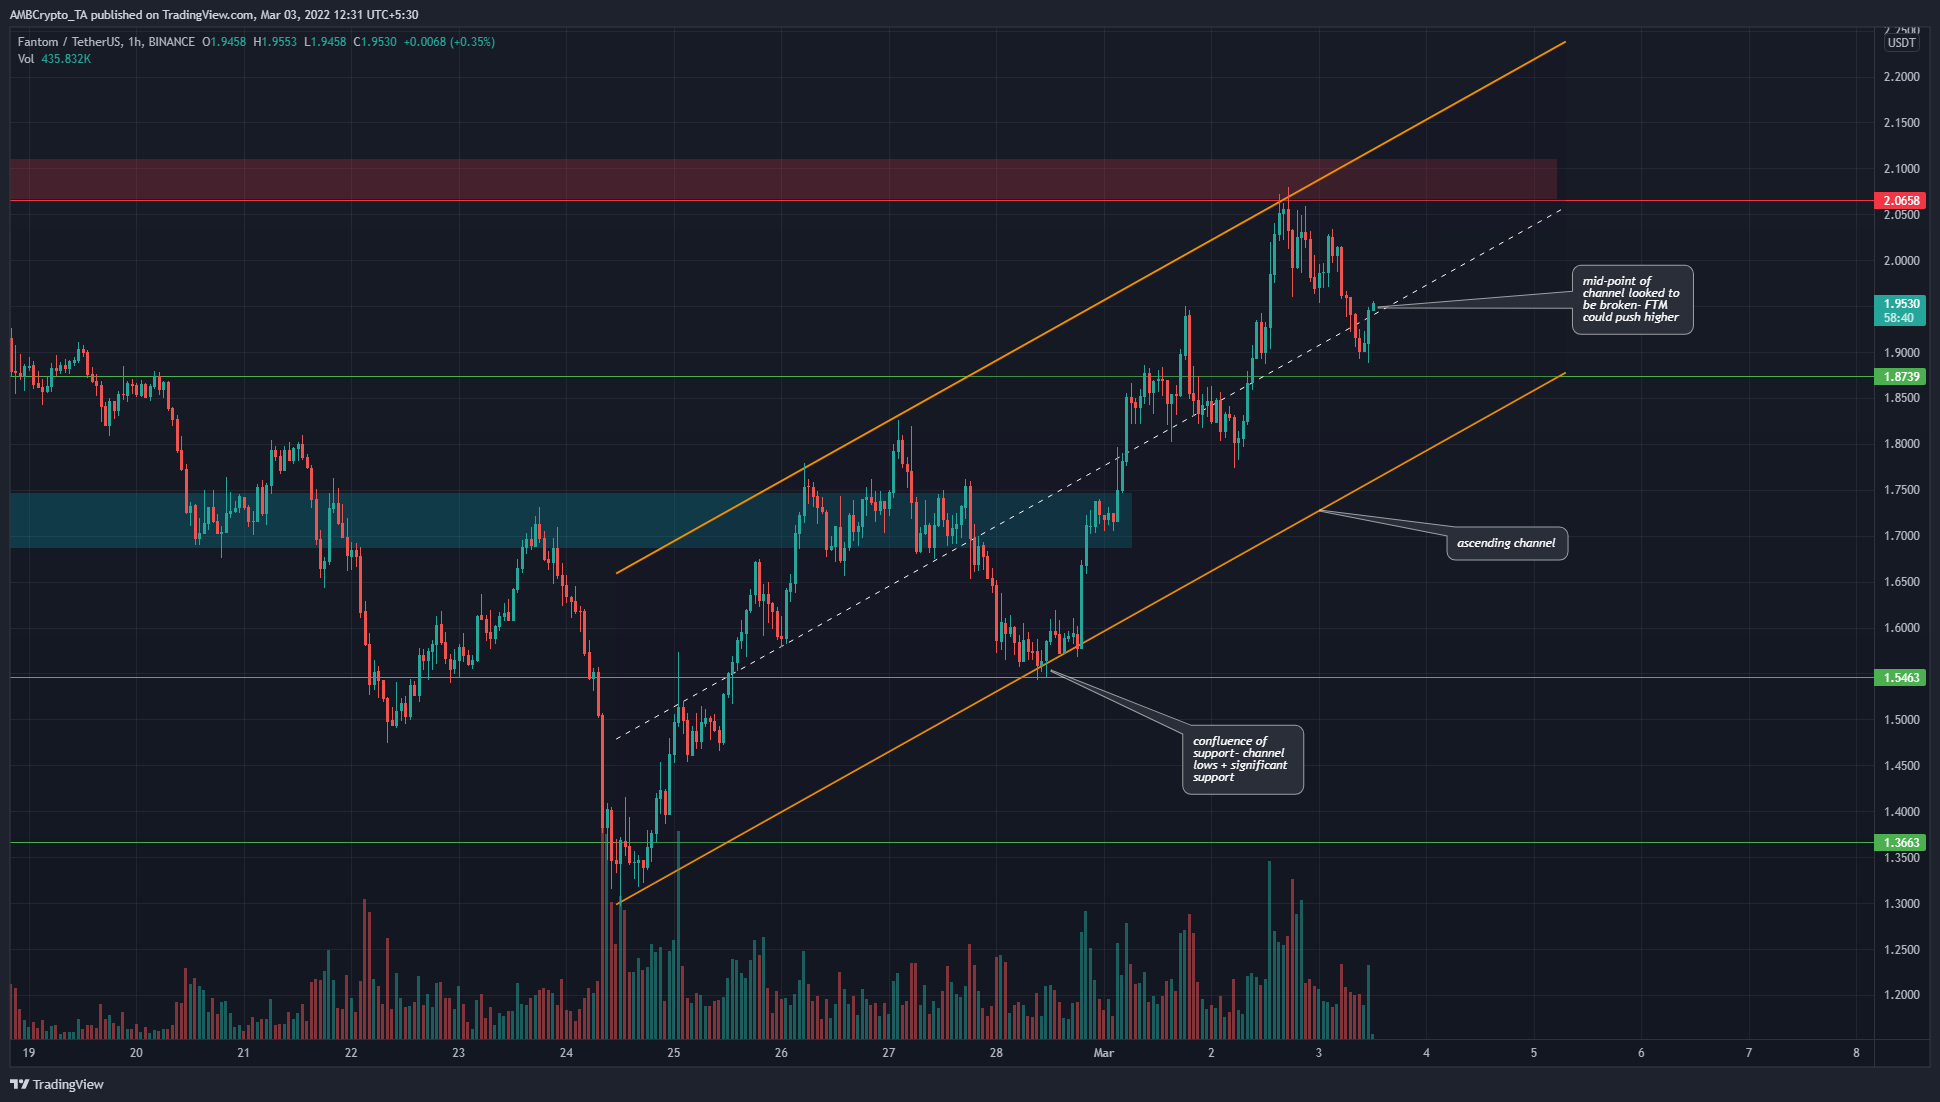
The ascending channel (orange) has been one that the price has been trading within for a little over a week. The $1.7-area (cyan box) had been a key area over the past couple of weeks. This was because the bears flipped this area to a supply zone. Only over the past week have the bulls been able to establish it as a demand zone.
When the price rose above $1.7 and retested the $1.54-support level, it was the first indication that the short-term market structure had flipped to bullish. The previous lower high at $1.65 was breached. Similarly, after bouncing from the $1.35 support (lower low), the price found support at $1.54 to register a higher low.
Hence, the short-term bias was considered to have flipped to bullish.
In the next couple of days, FTM bulls have to ensure that the price doesn’t drop below $1.8 and the channel lows. Going forward, the $2.05-$2.1 area has to be broken for FTM’s next leg upward.
Rationale
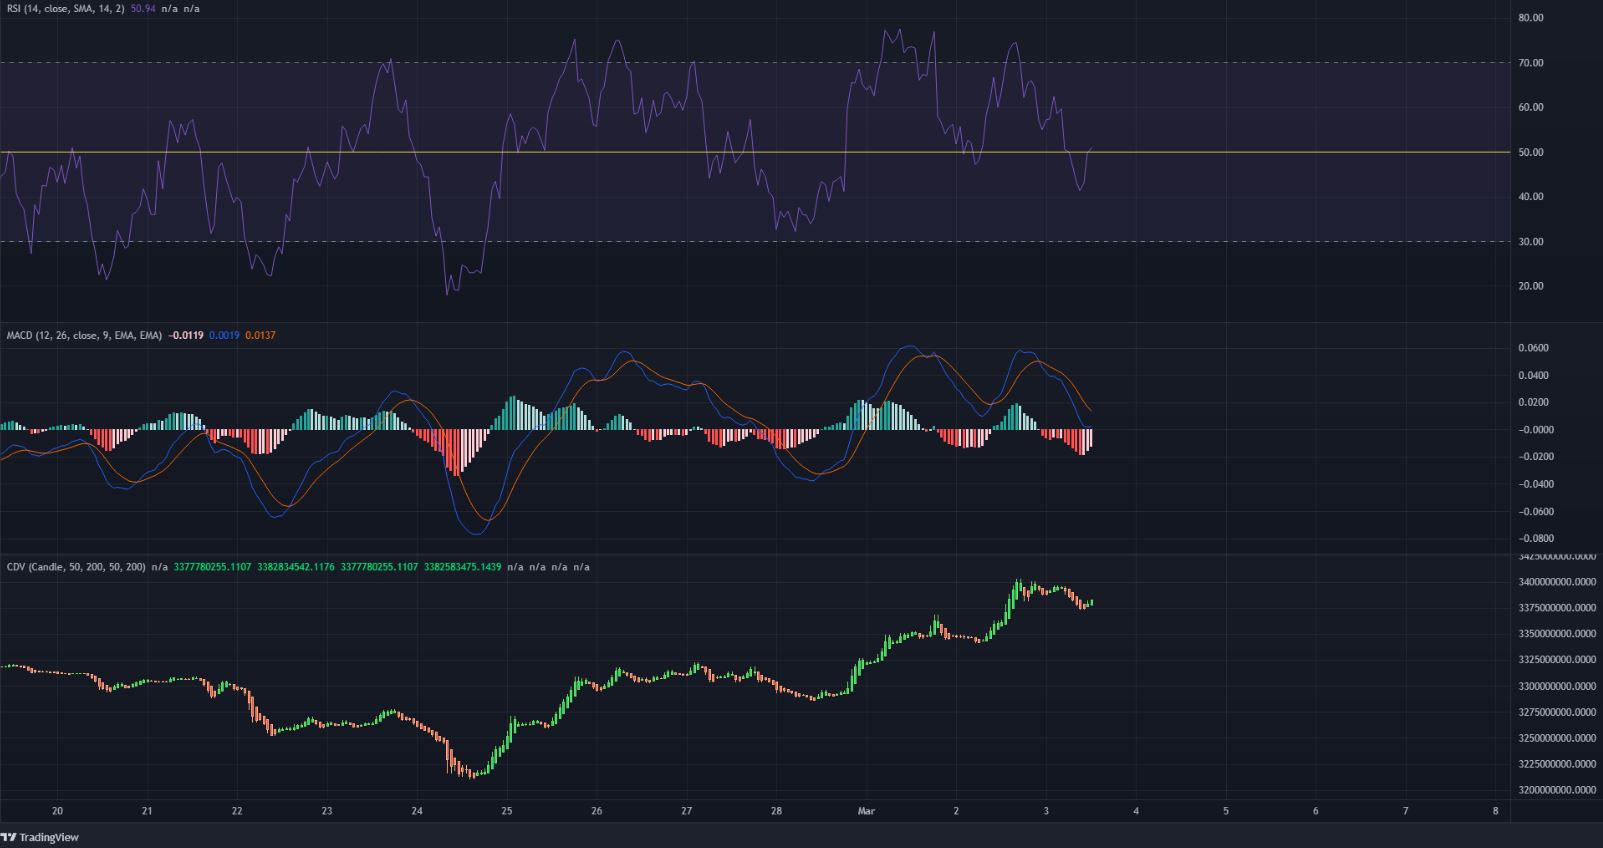
The RSI stood around the 50.9-mark, but has been above the zero line over the past few days. This indicated that while momentum has been bullish thus far, things could change if the RSI is unable to rise convincingly above neutral 50.
The MACD also showed that recent bullish momentum has been weakening when it formed a bearish crossover above the zero line.
The CDV revealed that past week’s rally has been on the back of steady demand. Hence, the rally is likely to be genuine and could continue higher as the market structure remains bullish in the near term.
Conclusion
There was a good amount of buying when FTM rallied from $1.35 to $1.95 in recent days. And, the trend could be set to continue. On the charts, the channel boundaries and mid-point are worth watching. Bitcoin could effect a minor pullback on Fantom’s prices though.
All things considered, however, FTM still seemed to have a bullish leaning.


