Binance Coin, Terra, GALA Price Analysis: 03 March

From its February lows, Binance Coin saw promising gains after forming a bullish pattern on its 4-hour chart. Similarly, Terra upturned from its longer timeframe 61.8% Fibonacci support and marked exponential gains in an up-channel.
Further, GALA’s RSI endeavored to shift the momentum in favor of buyers while the $0.286-level was still a barrier for the bulls.
Binance Coin (BNB)

After forming a long-term descending triangle, BNB broke down from the vital $512-mark. Since then, it witnessed numerous sell-offs that flipped the $414-level from support to immediate resistance. As a result, the alt headed south to hit its five-month low on 24 February.
Over the last few days, after falling from its up-channel (green), BNB saw an inverse head and shoulder on its 4-hour chart. Thus, the alt was up by nearly 25% over the last week. Furthermore, the 20 EMA (red) offered strong support after jumping above the 50 EMA (cyan).
At press time, the BNB traded at $404.7. The RSI rapidly grew in an up-channel during the last week. It showed an expected reversal from the overbought region while aiming to test the 58-support. Any close below this level could propel a further downfall.
Terra (LUNA)
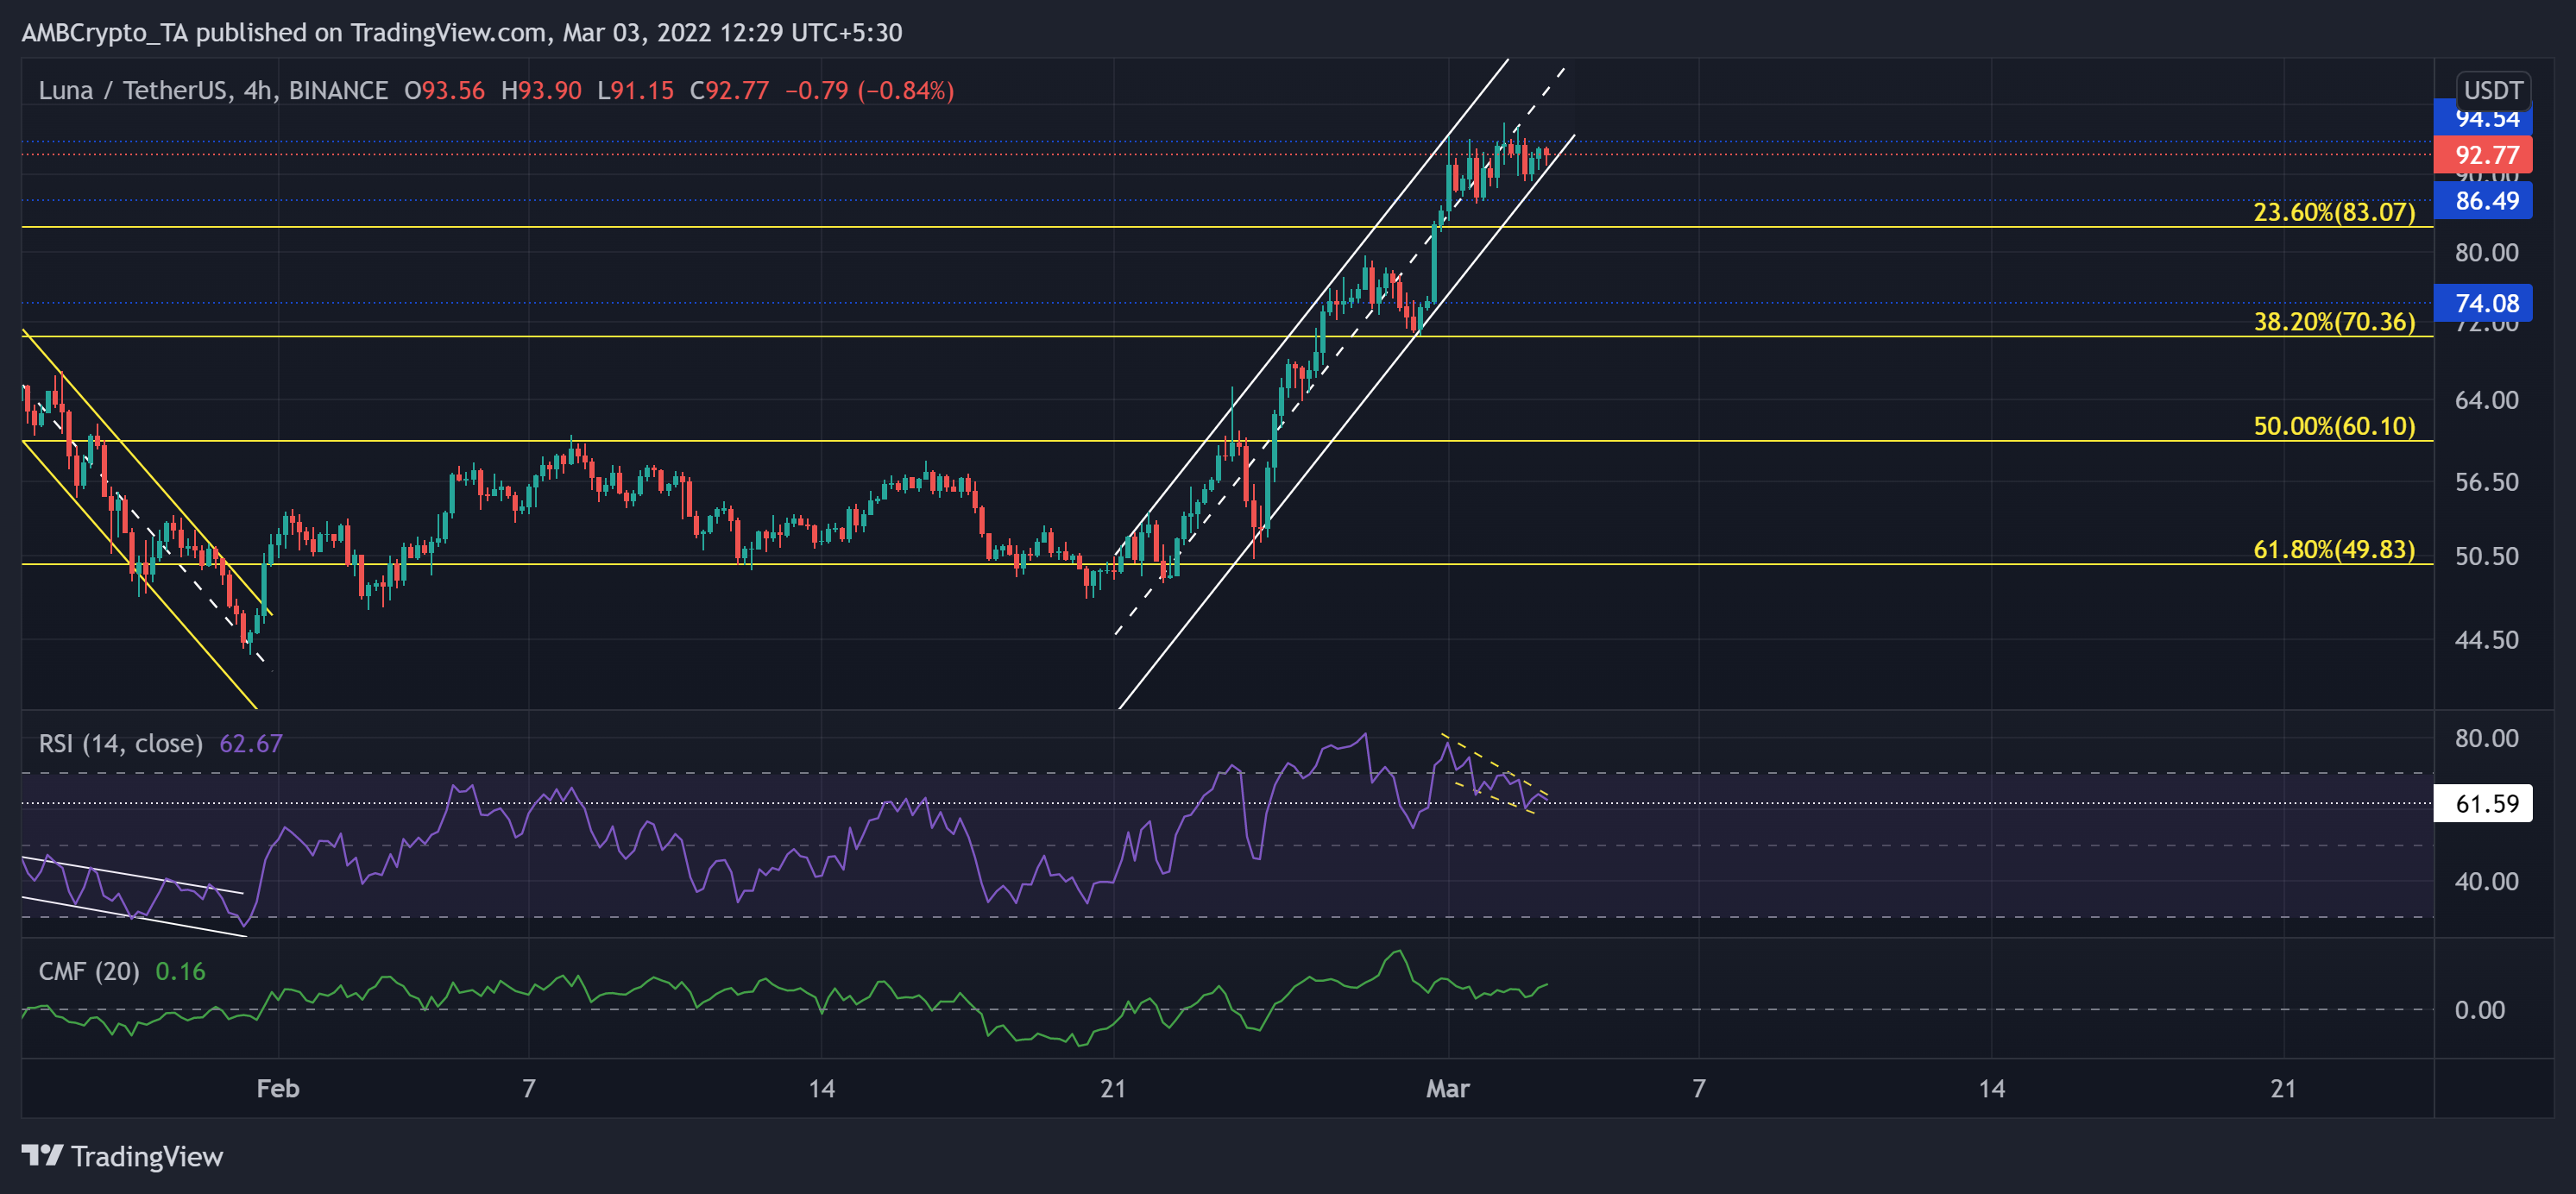
After breaking down from the up-channel from the $86-mark, LUNA lost half its value and plunged towards its two-month low on 31 January. This level coincided with the 61.8% Fibonacci support. Thus, after testing this level multiple times, LUNA initiated a recovery phase.
It saw exceptional gains of over 91.7% in the past nine days. But this up-channel seemingly halted at the $94-resistance. From here on, a close below the pattern could lead to a 23.6% Fibonacci level retest.
At press time, LUNA was trading at $92.77. The bullish RSI kept hovering above the 61-mark for the past few days. Now, it showed slowing signs from the overbought territory. Also, the CMF refrained from closing below the zero-line, keeping the bullish edge intact.
GALA
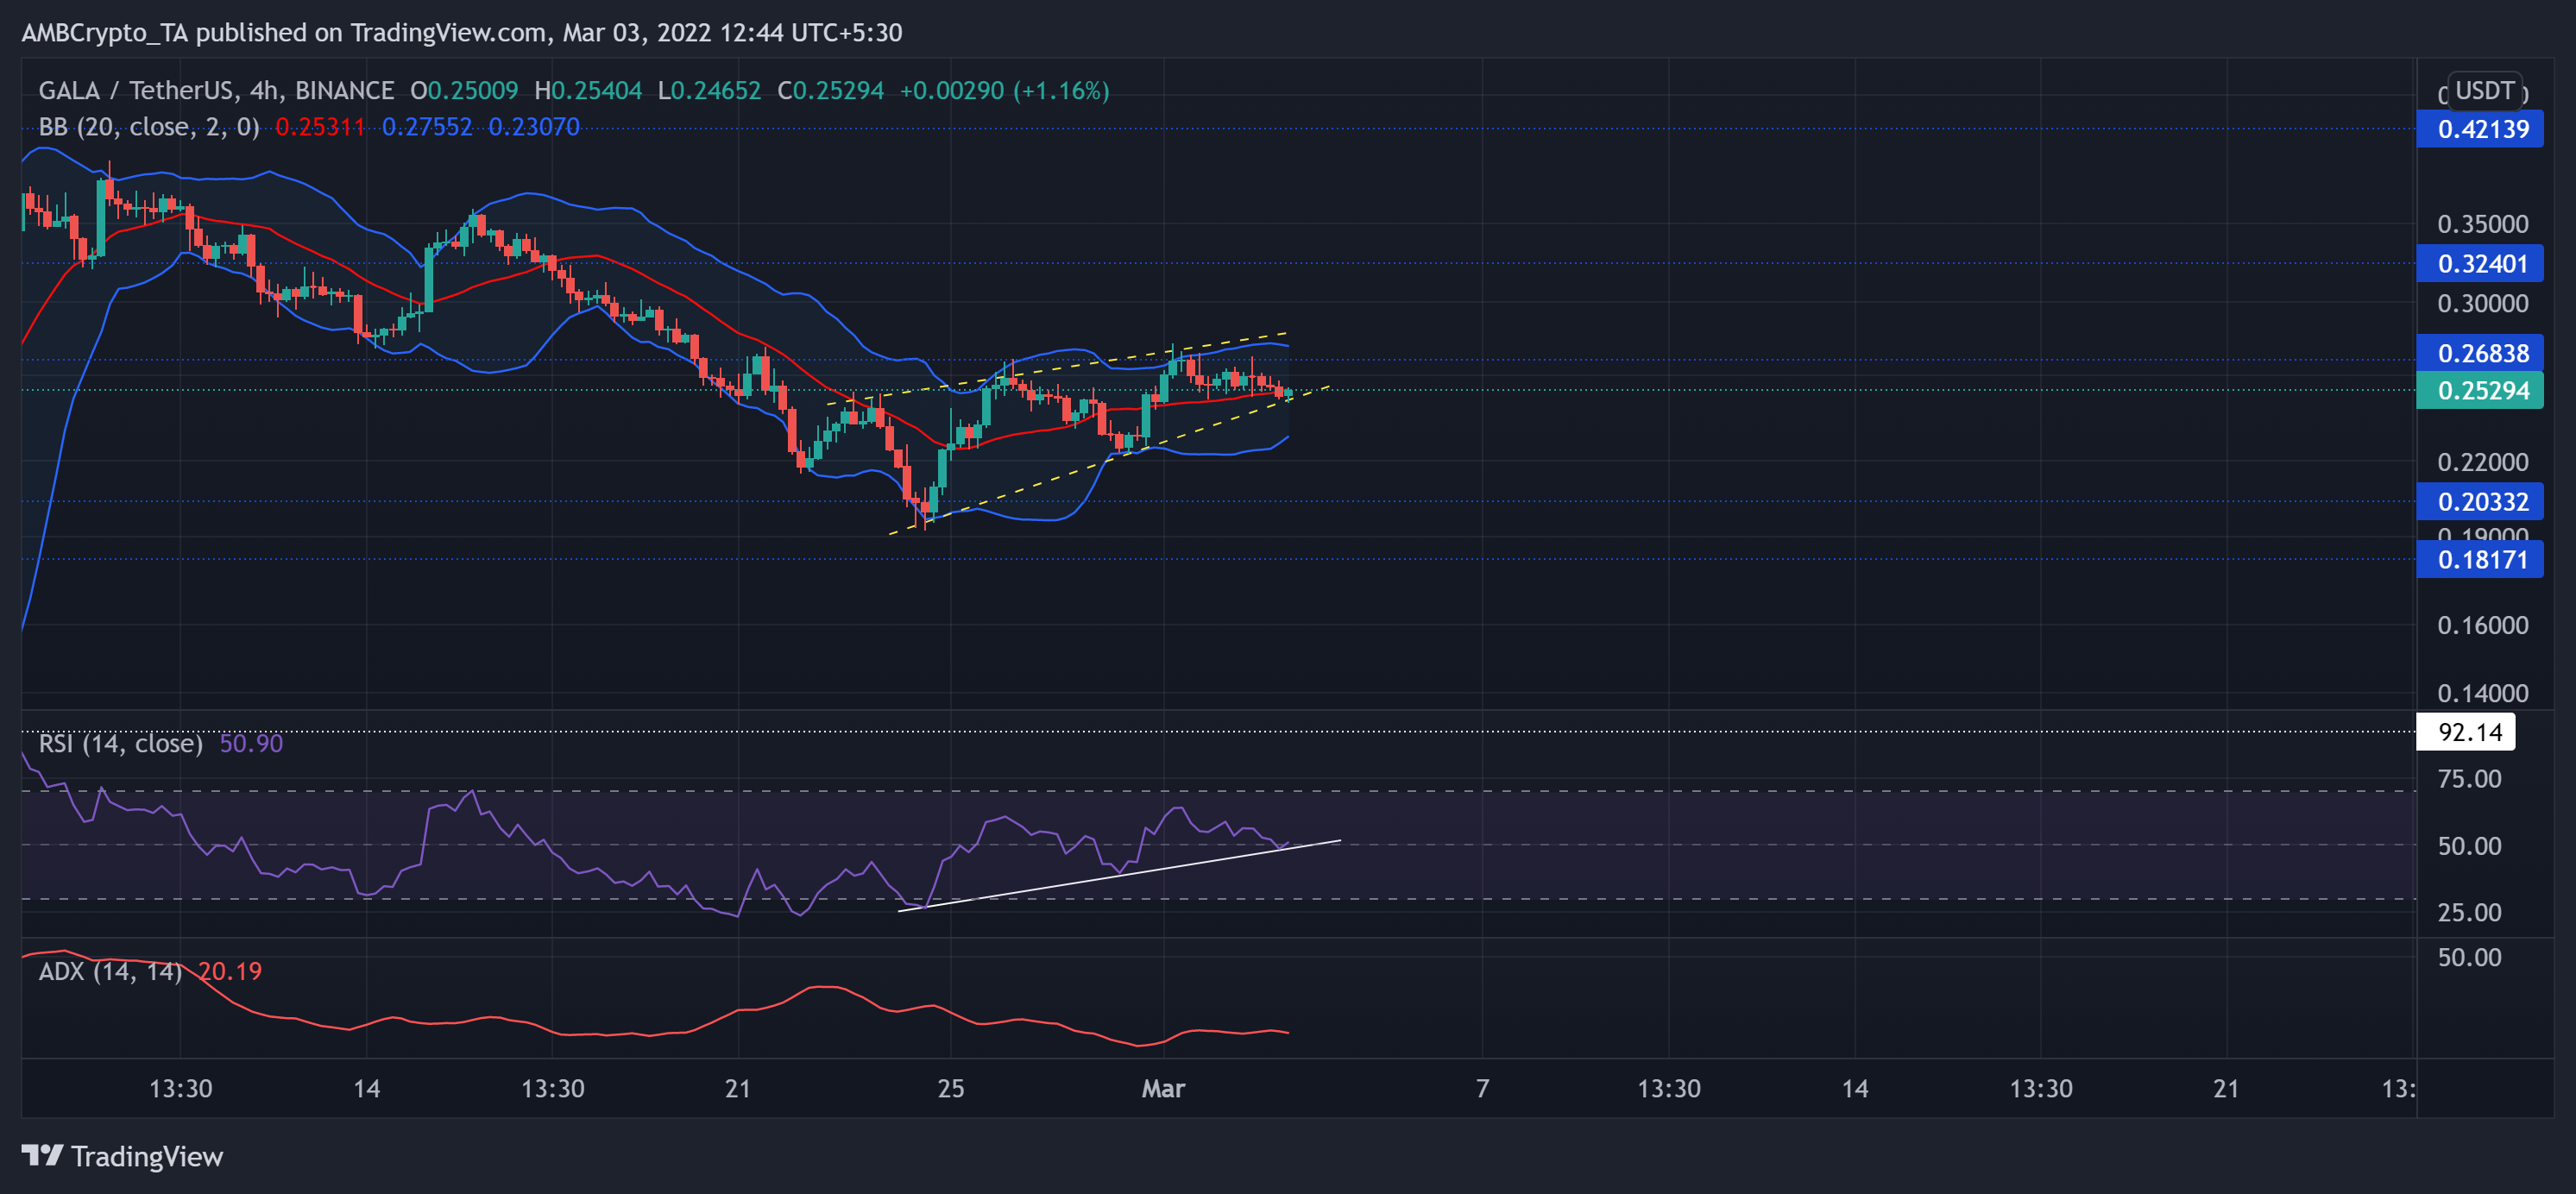
GALA lost its advantage after it failed to uphold the $0.421-level. Since losing this mark, it has been rangebound between the above level and the $0.181-mark.
The recent sell-off phase pushed GALA below the mean (red) of Bollinger Bands (BB). But the bulls quickly responded by propelling over 28% gains in the last six days. Consequently, it formed a rising wedge on its 4-hour chart. The immediate support stood near the mean of BB that corresponded with the lower trendline of the wedge.
At press time, GALA traded at $0.25294. The RSI was on a solid uptrend after forming steep trendline support (white trendline). Now, it eyed to find a close above the midline and display a slight bullish preference. Nevertheless, the ADX stood quite weak and revealed a weak directional trend.