Kaspa crypto jumps 28%: Will it hit $0.2 this week?
KAS currently exchanges hands at $0.17. Sustained buying pressure might push it above its all-time high of $0.18.

- KAS’ price has surged by 66% in the last month.
- The altcoin is gearing towards reclaiming its all-time high.
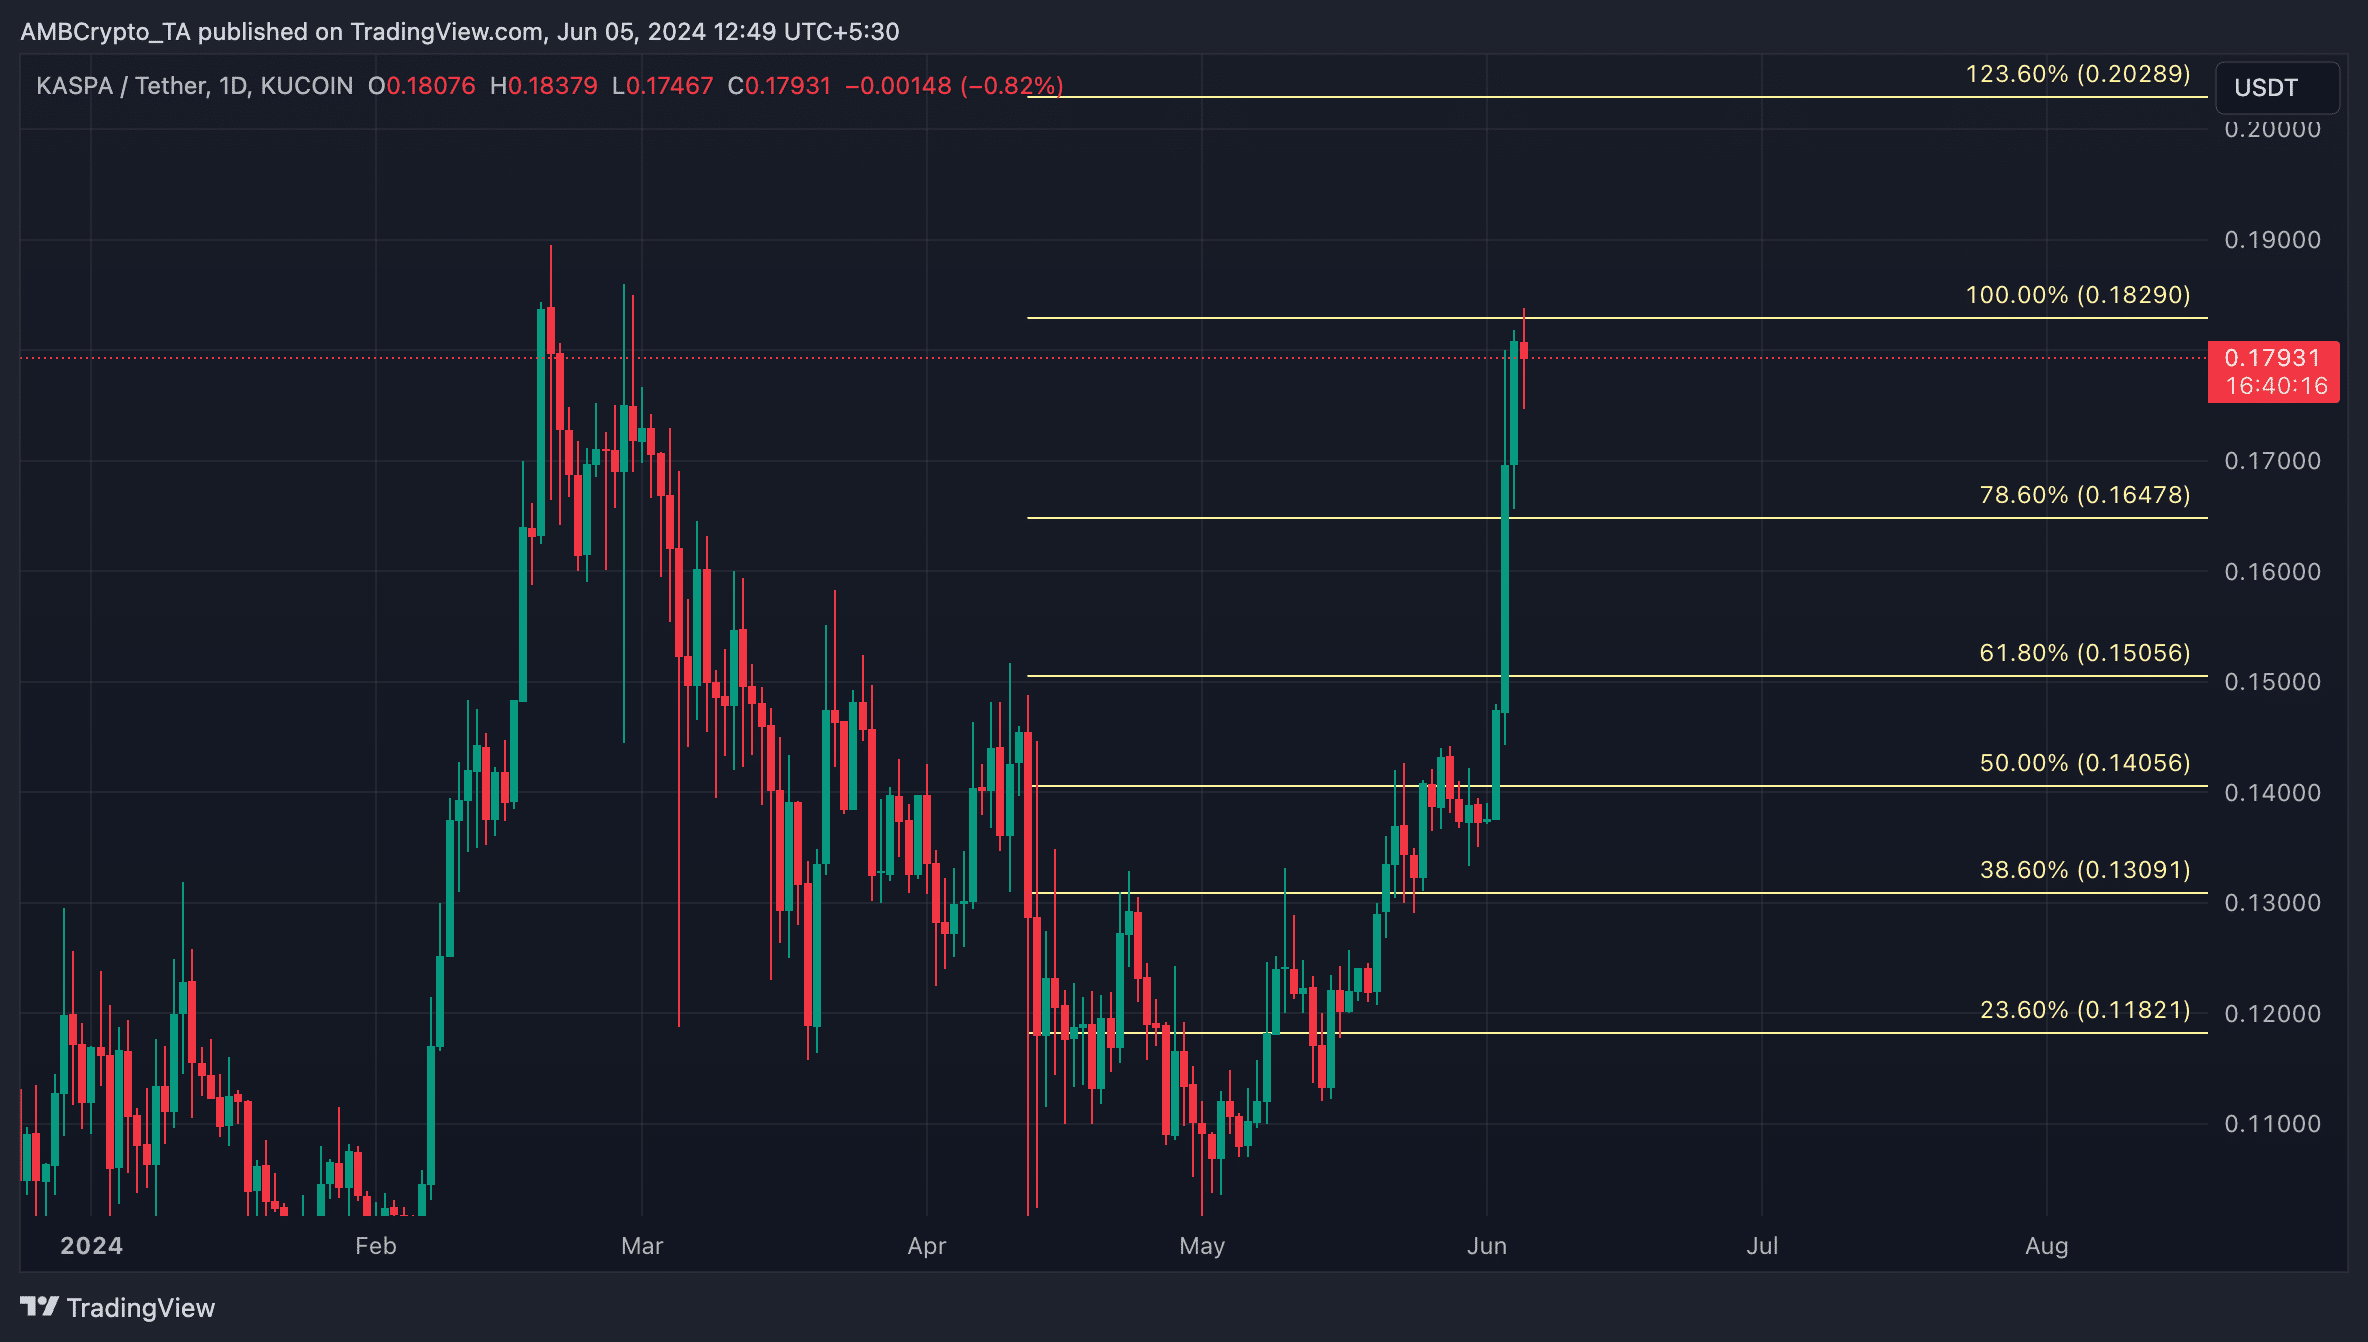
Proof-of-work (PoW) cryptocurrency Kaspa [KAS] is poised to reclaim its all-time high of $0.18, following its rally above the long-term resistance level formed at $0.14.
KAS’ price trended within a range between 12th April and 2nd June, leading to the formation of a horizontal channel.
This channel is formed when an asset’s price consolidates within a range because a balance between buying and selling pressures prevents the price from trending strongly in either direction.
The upper line of this channel forms resistance, while the lower line represents support. KAS had faced resistance at the $0.14 price level, while it found support at $0.1.
Kaspa crypto’s rally toward its all-time high
Since June started, KAS has witnessed a surge in trading volume. For example, on 3rd June, the altcoin’s daily trading volume totaled $165 million, representing its highest level since November 2023, according to Santiment’s data.
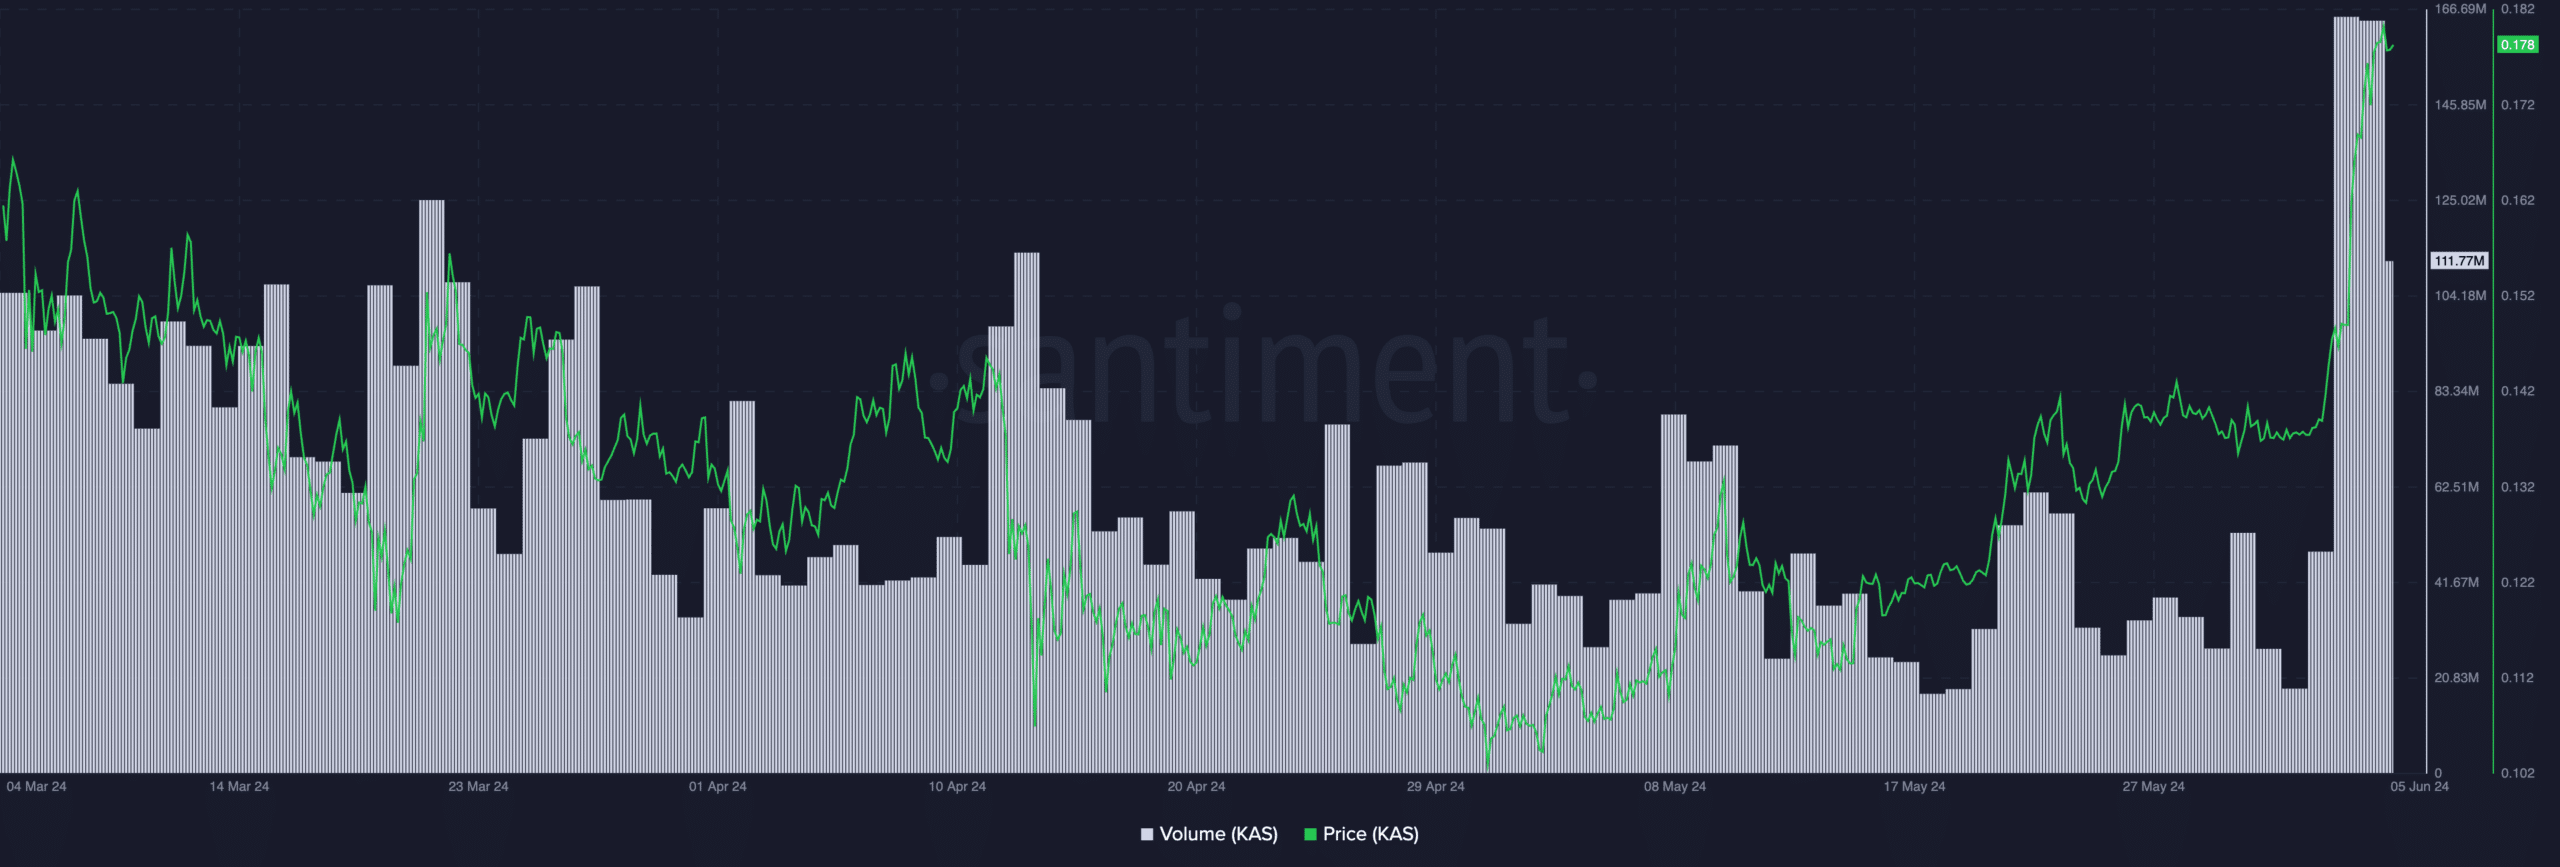
This surge in trading activity pushed KAS’ price above the upper line of its horizontal channel on 3rd June, indicating that it closed above resistance on that day.
Trading at $0.1797 at press time, KAS’ price has continued its uptrend and is trending towards its all-time high of $0.18, which it recorded on 20th February.
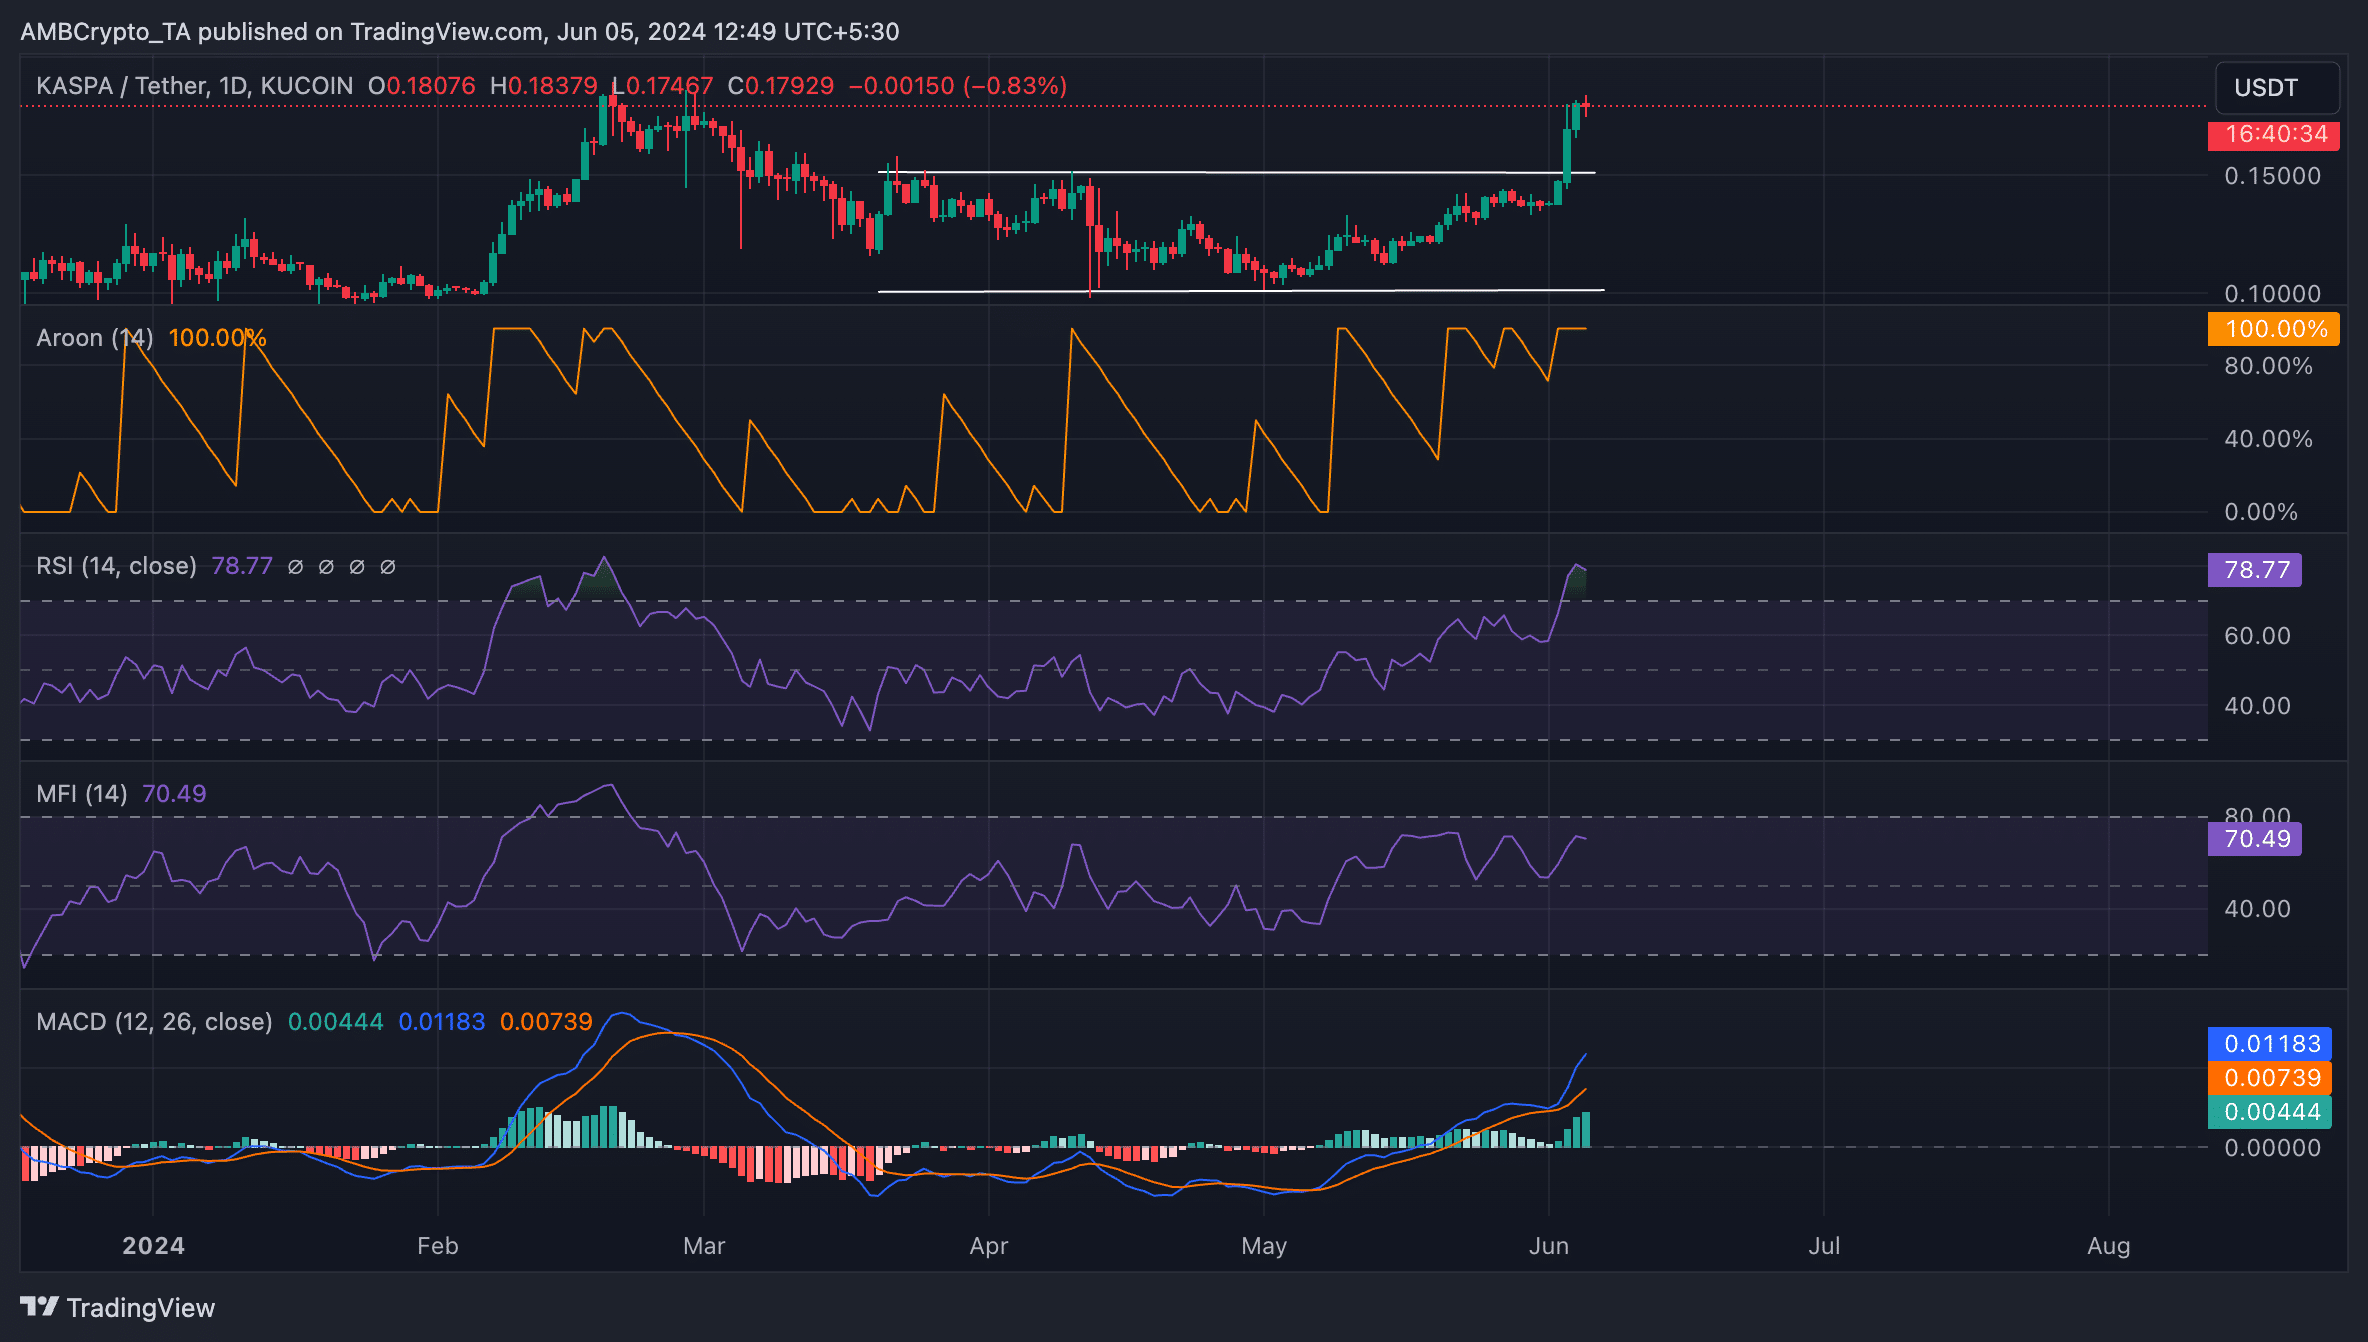
Readings from its price movements on a one-day chart suggested that it may continue its uptrend. For example, its Aroon Up Line (orange) was 100% at press time.
This indicator identifies the strength of an asset’s price trend and its potential reversal points.
When the Aroon Up line is close to 100, it signals that the uptrend is strong and that the most recent high was reached relatively recently. It is a bullish signal.
The altcoin’s Relative Strength Index (RSI) and Money Flow Index (MFI) were 79.91 and 70.44, respectively, confirming the surge in demand. These indicators showed that KAS’s buying momentum outweighed its selling pressure.
Also, KAS’ MACD line (blue) rested above its signal line (orange) as of this writing. When these lines are positioned this way, it is a bullish signal. It suggests that an asset’s short-term average is above its long-term average.
Read Kaspa [KAS] Price Prediction 2024-25
Traders interpret it as a sign to open long and exit short positions.
If KAS’ buying momentum is sustained, its price may rally past its all-time high to trade at $0.2.