‘Lagging’ Bitcoin Cash could rally soon only if…

Disclaimer: The findings of the following analysis are the sole opinions of the writer and should not be considered investment advice
Bitcoin climbed by nearly 8% over the past couple of days, from the lows of $45.6k to $49.3k, before descending slightly to trade at $48.9k at press time. Even so, it remains likely that Bitcoin will climb to $51k-$52k again and could move the wider crypto market north alongside it.
On the contrary, Bitcoin Cash has gained by only 4% over the said timeframe. Simply put, Bitcoin Cash may be lagging behind.
Bitcoin Cash 1-hour chart

Source: BCH/USDT on TradingView
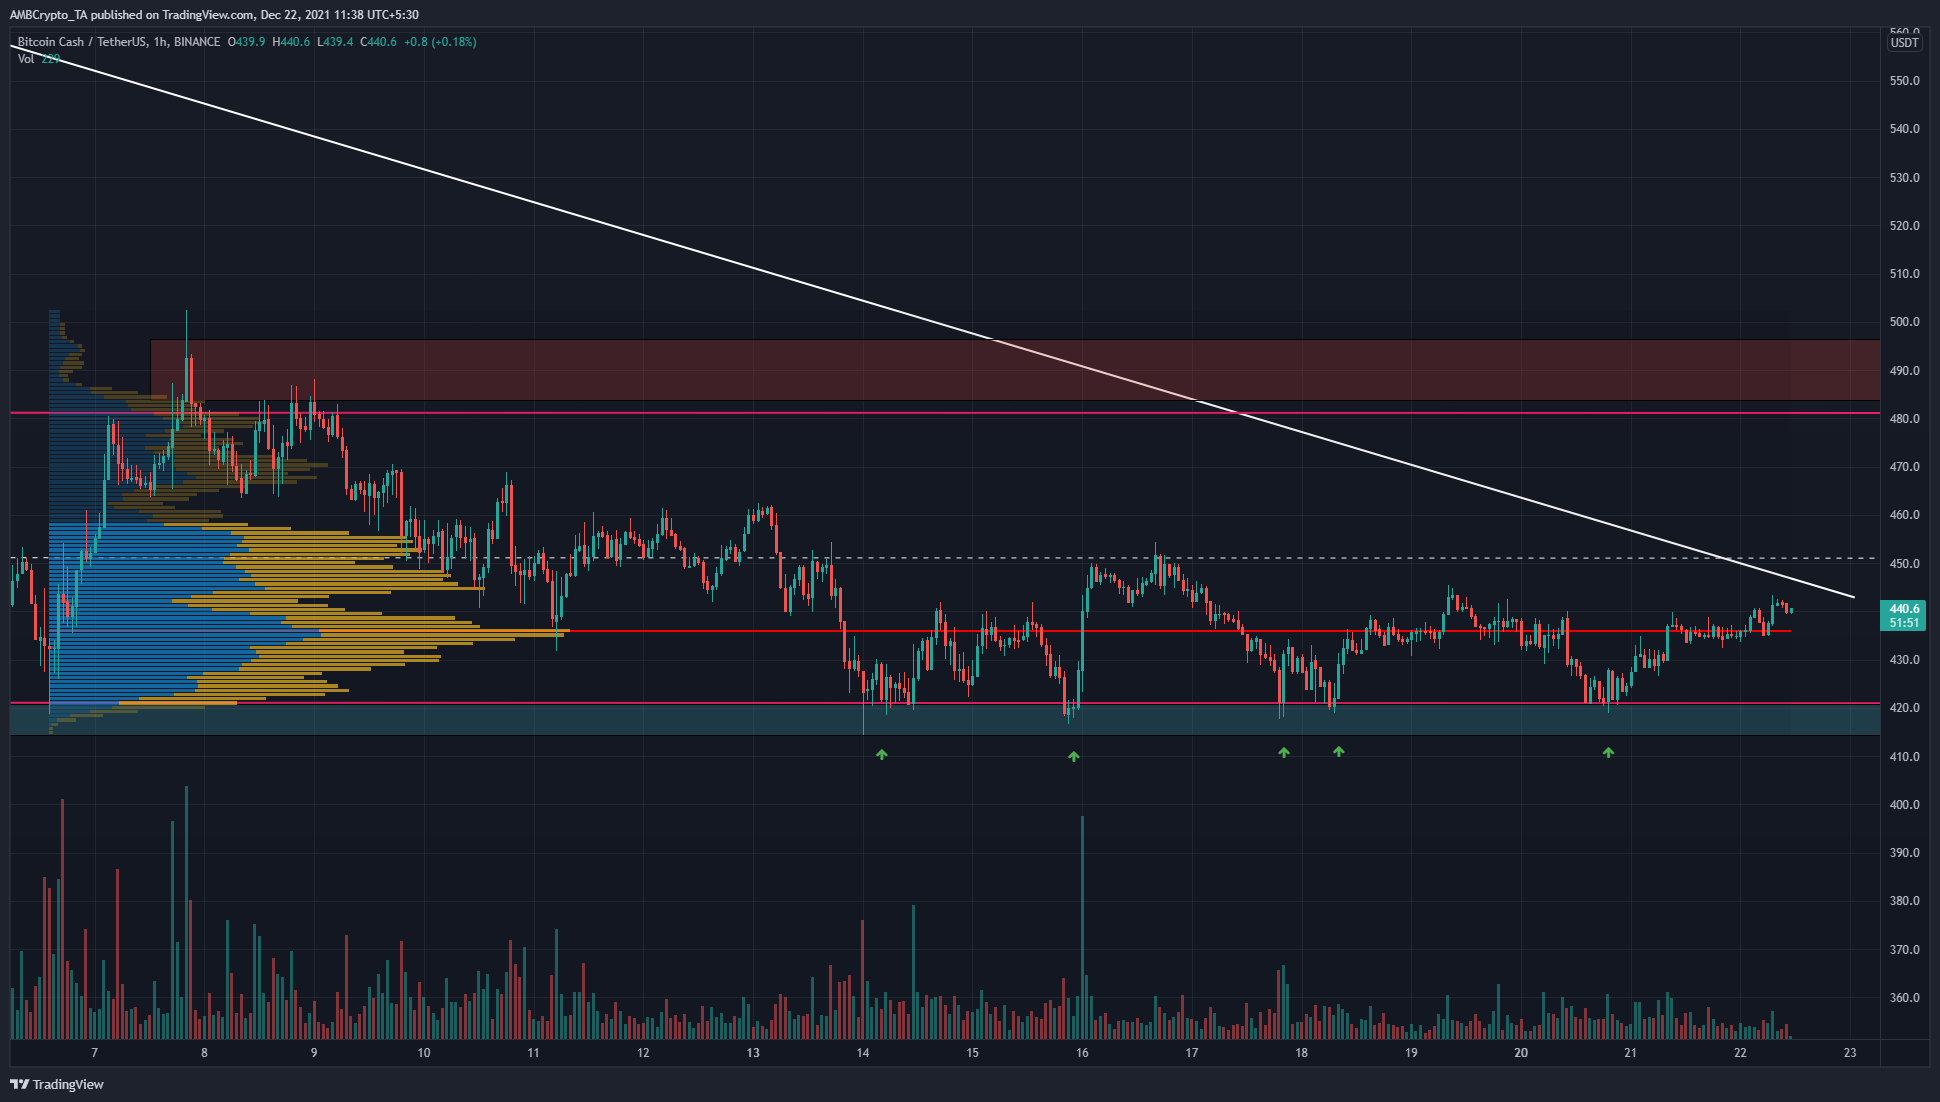
The price action over the past two weeks was a range, from the $490 band (red box) to the $415 band (cyan). The price has tested this area for demand multiple times over the past week and has bounced following each retest. The most recent bounce struggled to push BCH above $435, and the $450-level also acted as resistance.
Plotting a range between $421 and $481, the middle of the range (dotted white) was $451, representing significant resistance. Apart from this, the entire region from $430-$450 seemed to be an important higher timeframe area, meaning that there was likely to be a lot of liquidity for bulls to chew through before climbing higher.
The trendline resistance (white) was plotted from early November, and remained unbeaten, adding to the resistance to an upside for BCH.
The low trading volume, combined with relatively strong buying in the $420-area, indicated a possible accumulation phase.
Rationale

Source: BCH/USDT on TradingView
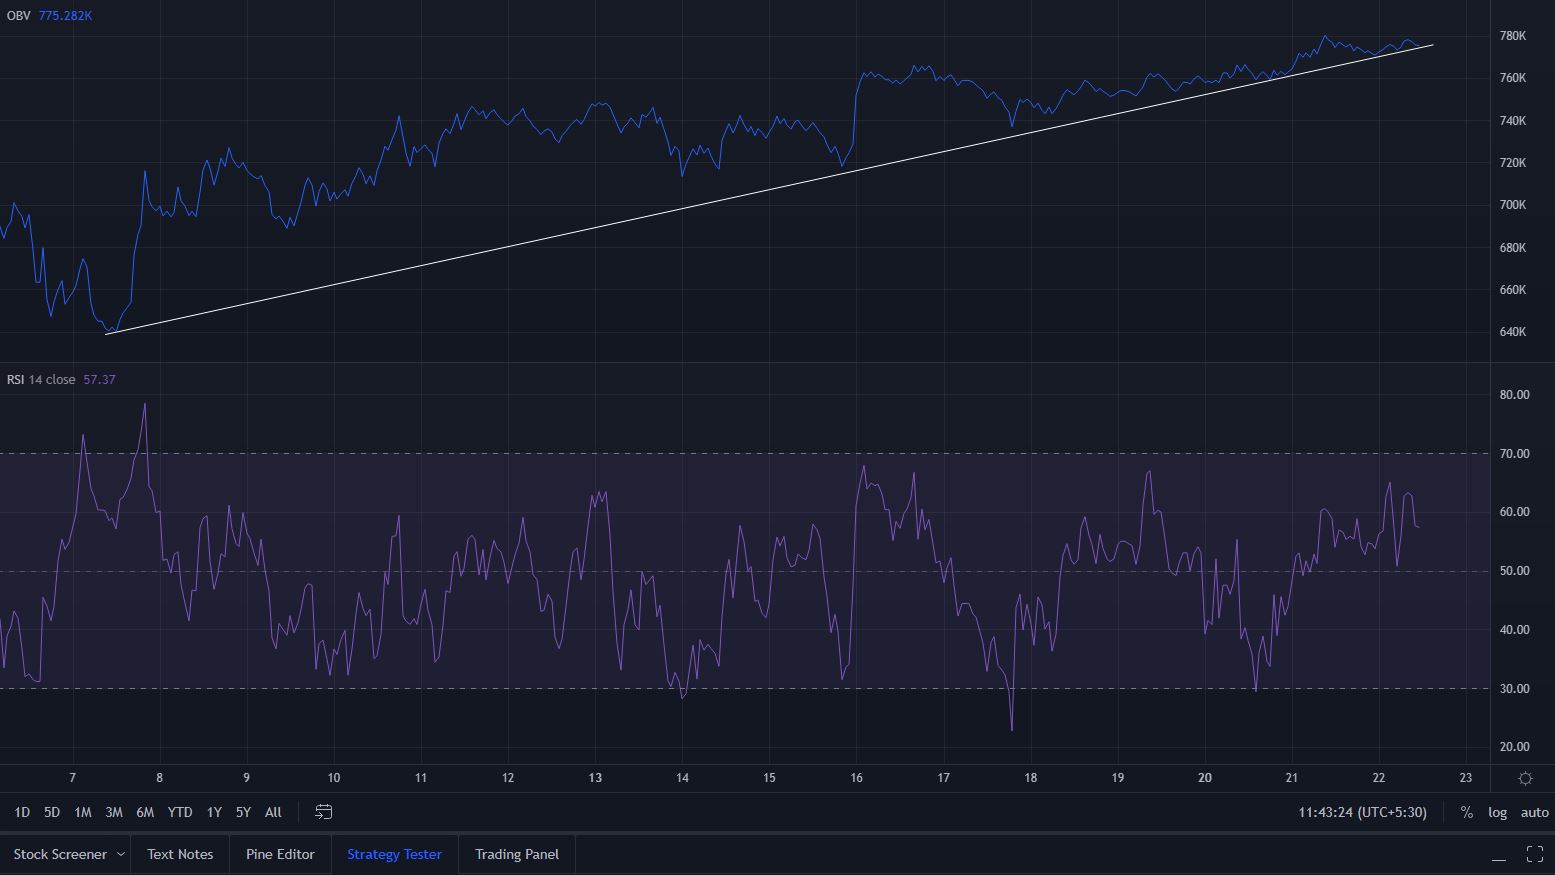
The OBV has continued to climb in recent days, meaning buyers have been strong in the market. This was also an encouraging sign for bulls. The RSI was unable to climb above 67.7, although it remained above neutral 50 to highlight recent bullish momentum.
On the price chart, the Fixed Range Volume Profile was plotted from the 6th of December when the price tested the lows at $420.
One positive that the bulls can take is that the price was above the Point of Control (red) at $436, although the FRVP also indicated strong resistance around $450.
Conclusion
The dead cat bounce earlier this month after the heavy sell-off saw BCH establish a range between $480 and $420. Since then, the price has tapped the range lows in search of demand multiple times and bounced each time. Buying pressure has been climbing, even as BCH faced strong resistance from $430-$450 and another level at $470. Trading volume has been low, with market participants sidelined and buying the $420 retests.
In conclusion, BCH has been in an accumulation phase over the past two weeks, and climbing above $450 will likely see it reach the $490 zone.


