Solana, Ethereum Classic, Decentraland Price Analysis: 22 December

Although the fear sentiment lightened, the bulls failed to gather increased trading volumes for depicting a strong trend reversal. Consequently, SOL showed slackening signs after poking the $187-level.
While Ethereum Classic and MANA saw a decent week-long recovery, the overall directional trend still remained weak.
Solana (SOL)

A sharp trend reversal seemed to take place for SOL ever since it poked its two-month low on 13 December. Post a falling wedge (green) breakout, the altcoin steadily marked higher lows while maintaining the flat upper trendline (white). Thus, forming an ascending triangle on its 4-hour chart after a v-shaped recovery over the past three days.
SOL noted a 25.61% ROI (since 13 December low) and found support at the 50-SMA (red) for over a week now. It becomes crucial to take note of the lower highs marked on the volume oscillator, indicating a weak bullish move.
At press time, SOL traded at $184.8425. The RSI swayed in favor of bulls but showed slight weakening signs. Further, DMI flashed a bullish bias, but the ADX displayed a substantially weak directional trend for SOL.
Ethereum Classic (ETC)
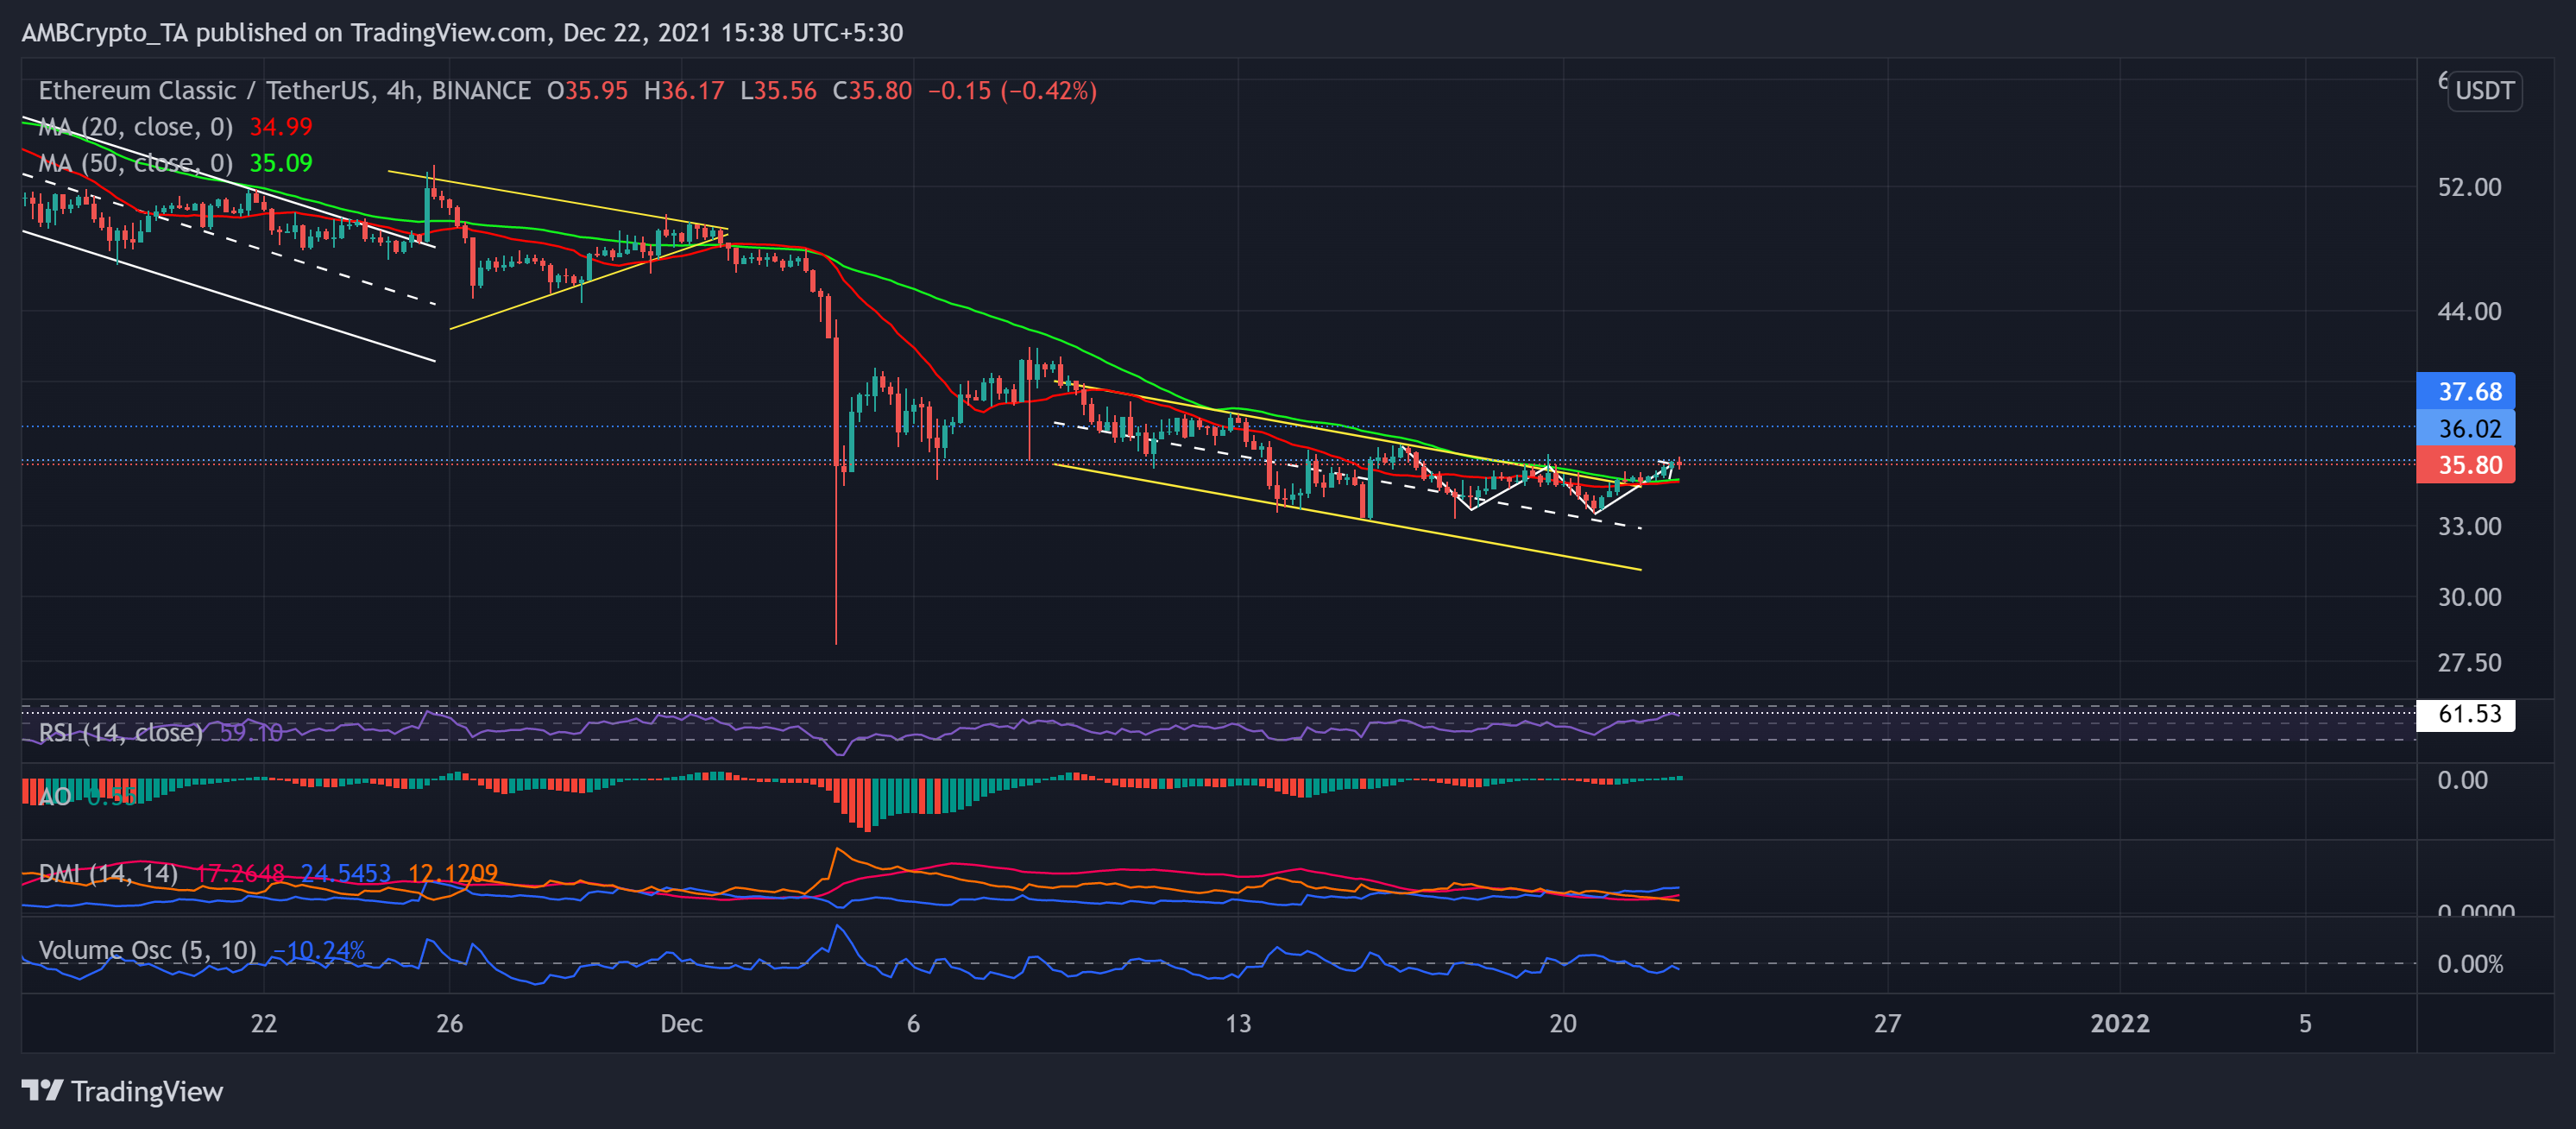
Since 10 November, ETC has been on a constant decline as it registered an over 44% fall since then. This fall gravitated below its long-timeframe (34 weeks) previous support at the $36-mark.
Since 15 December, bulls retested the upper channel (yellow) thrice before breaking out as the price swayed above the midline (dashed, white). With this push, ETC managed to break above the 20-50 SMA but still found immediate resistance at the $36-mark.
At press time, ETC traded at $35.8. The RSI was in an uptrend poked its one-month high on 22 December. Further, the AO noted bullish twin peaks below the equilibrium and saw an expected push above the zero-line. The DMI also projected a bullish comeback, but the ADX displayed a weak directional trend.
However, the recent bullish push was on rather decreasing trading volumes, signaling a weak move on their part.
Decentraland (MANA)
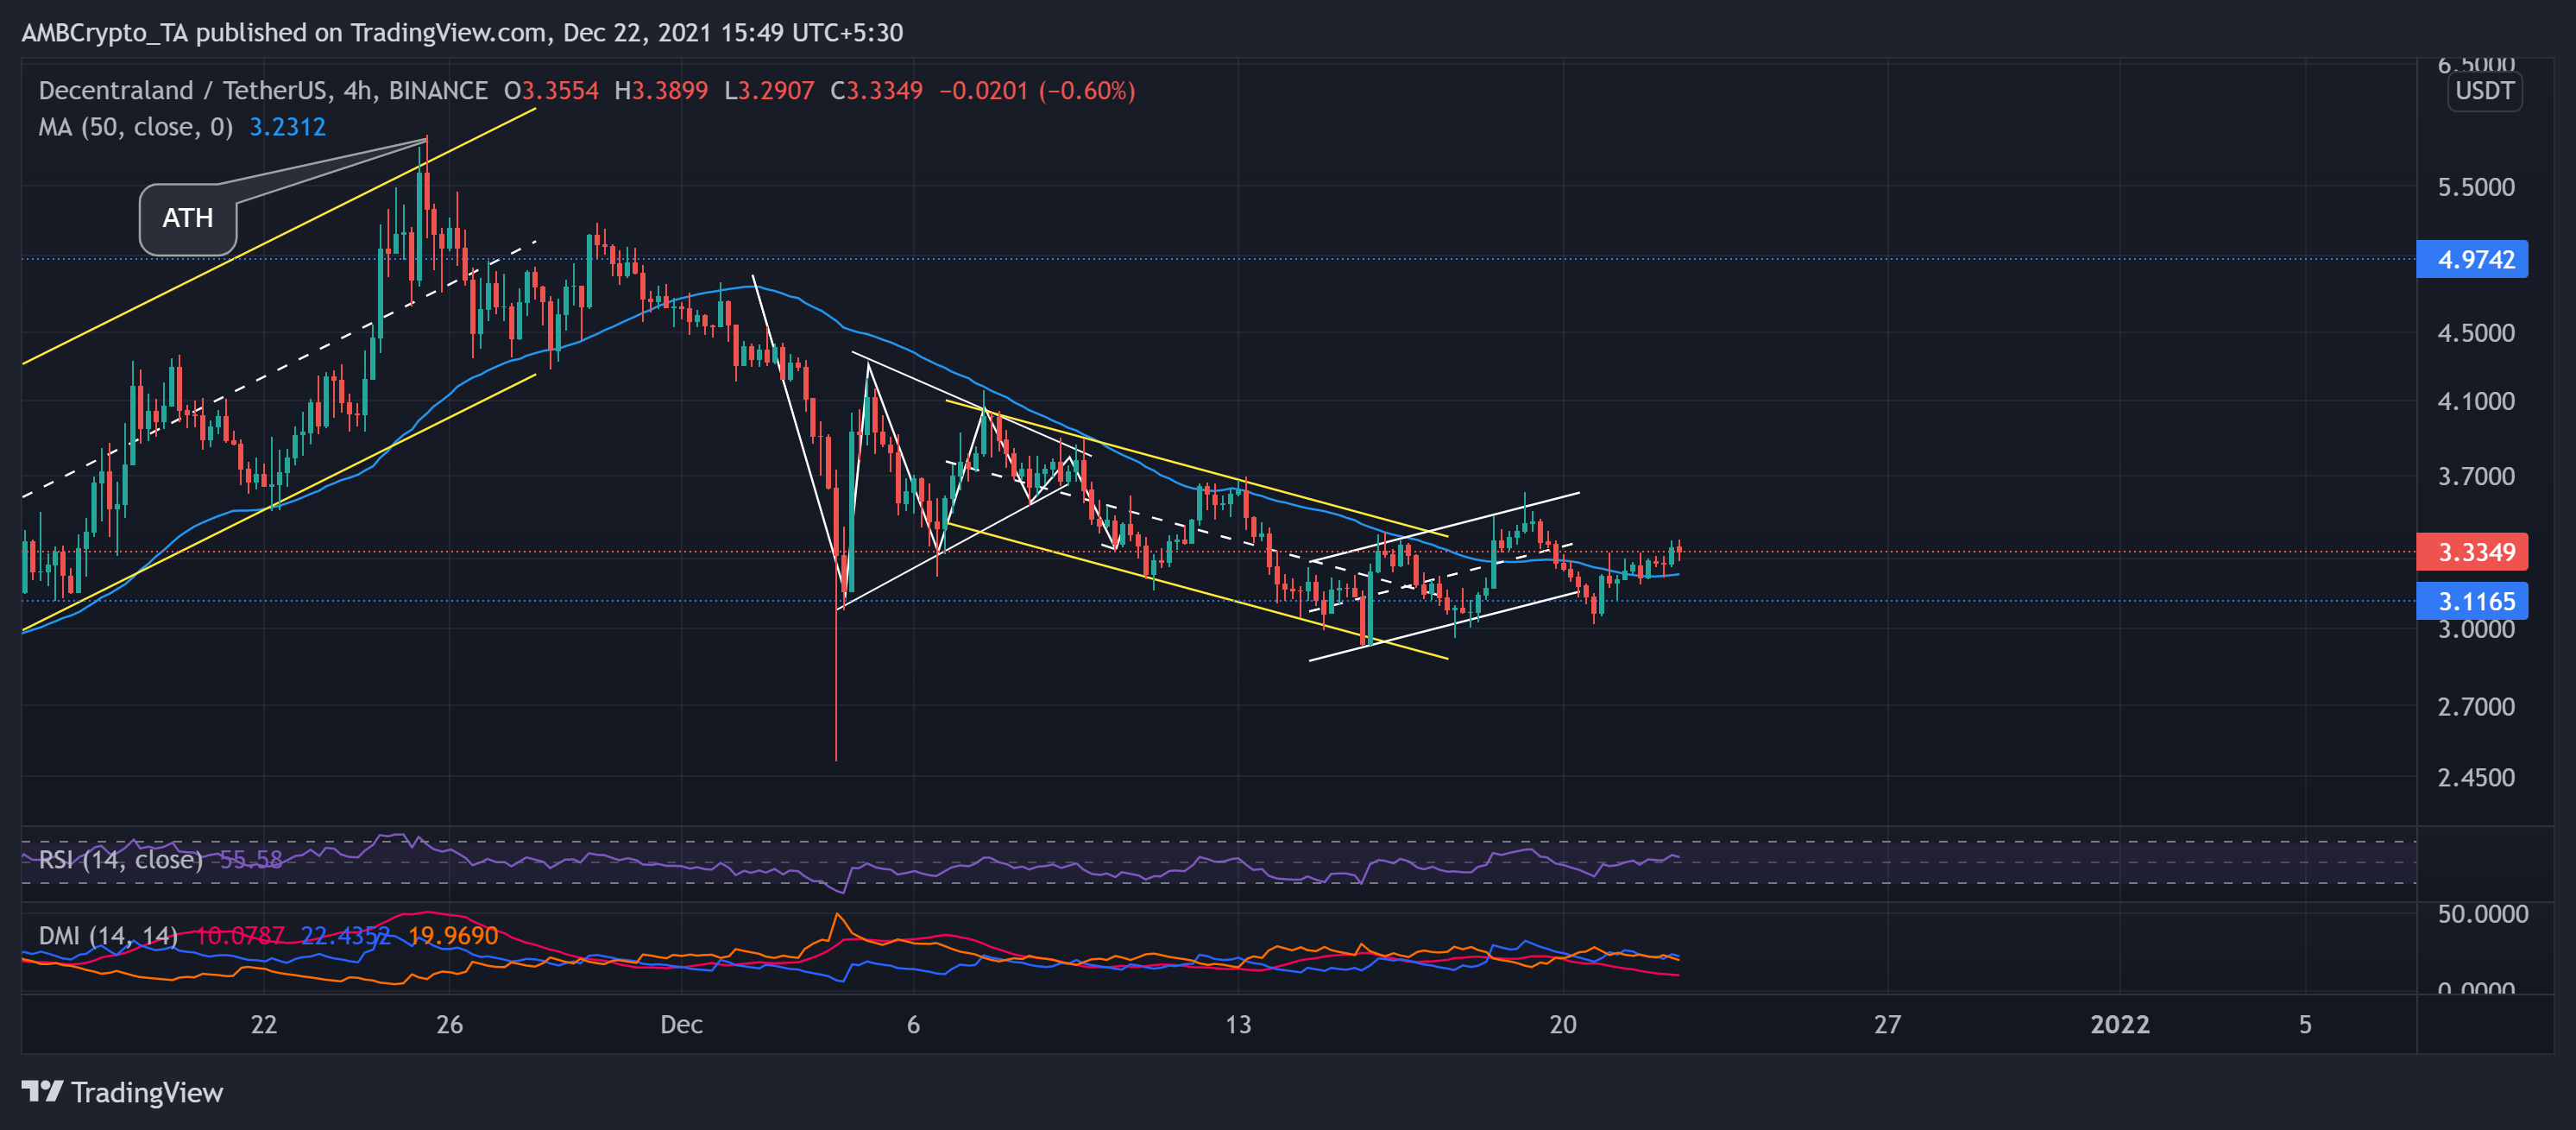
MANA saw a bearish pennant breakout on 9 December. This fall transposed into a down-channel after the alt noted a 25.83% decline from 7 to 15 December.
Despite the fall, the bulls ensured the one-month support at the $3.11-mark. As a result, MANA noted a 13.2% six-day push above the 50-SMA (blue). This level stood as resistance since the beginning of this month but now flipped into its immediate testing support, indicating increasing bullish influence.
At press time, MANA traded 43.1% below its ATH at $3.3349. The RSI was at the 55-mark and showed loosening signs. While the DMI depicted a marginal buying preference, the ADX displayed an extremely weak directional trend.


