LINK embarks on a crazy bullish run after breaching its 18-month resistance
From a technical standpoint the recent LINK breakout past the $10 mark was clean. The On-Balance Volume (OBV) pushed above a resistance level that hasted lasted all through 2023.

Disclaimer: The information presented does not constitute financial, investment, trading, or other types of advice and is solely the writer’s opinion.
- Chainlink broke out of a 1.5-year-long range to suggest that a long-term uptrend has started
- Buyers can wait for a dip toward the former range highs before entering the market
Chainlink [LINK] posted massive gains over the past six weeks. The token was trading at $6 in late August but shot higher to reach $11.78 a few hours before press time and could push higher.
A particular metric pointed to an overvalued LINK and an imminent correction. Although the overall sentiment remained firmly bullish based on social media engagement.
Read Chainlink’s [LINK] Price Prediction 2023-24
A report from AMBCrypto dated 22 October analyzing Chainlink’s lower timeframe price action highlighted that the $11-$12 region was a higher timeframe resistance zone. As things stand, the $12 mark hasn’t been breached yet.
The long-term range was broken but buyers must avoid FOMO

From a technical standpoint, the recent LINK breakout past the $10 mark was clean. The On-Balance Volume (OBV) pushed above a resistance level that lasted all through 2023. The Chaikin Money Flow (CMF) signaled significant capital flow into the market, and the Relative Strength Index (RSI) was at 78 on the three-day chart.
This represented overbought conditions but was not a guarantee of a large pullback. However, there was a bearish order block on the one-day chart from May 2022 that stretched from $11.3 to $12.3. Bears could force LINK to retrace from this region.
A drop to the psychological $10 level would be a good buying opportunity as it would also be a retest of the former range high. Long-term buyers can wait for such a dip instead of chasing green candles.
On-chain metrics pointed toward LINK accumulation except for one unsettling observation
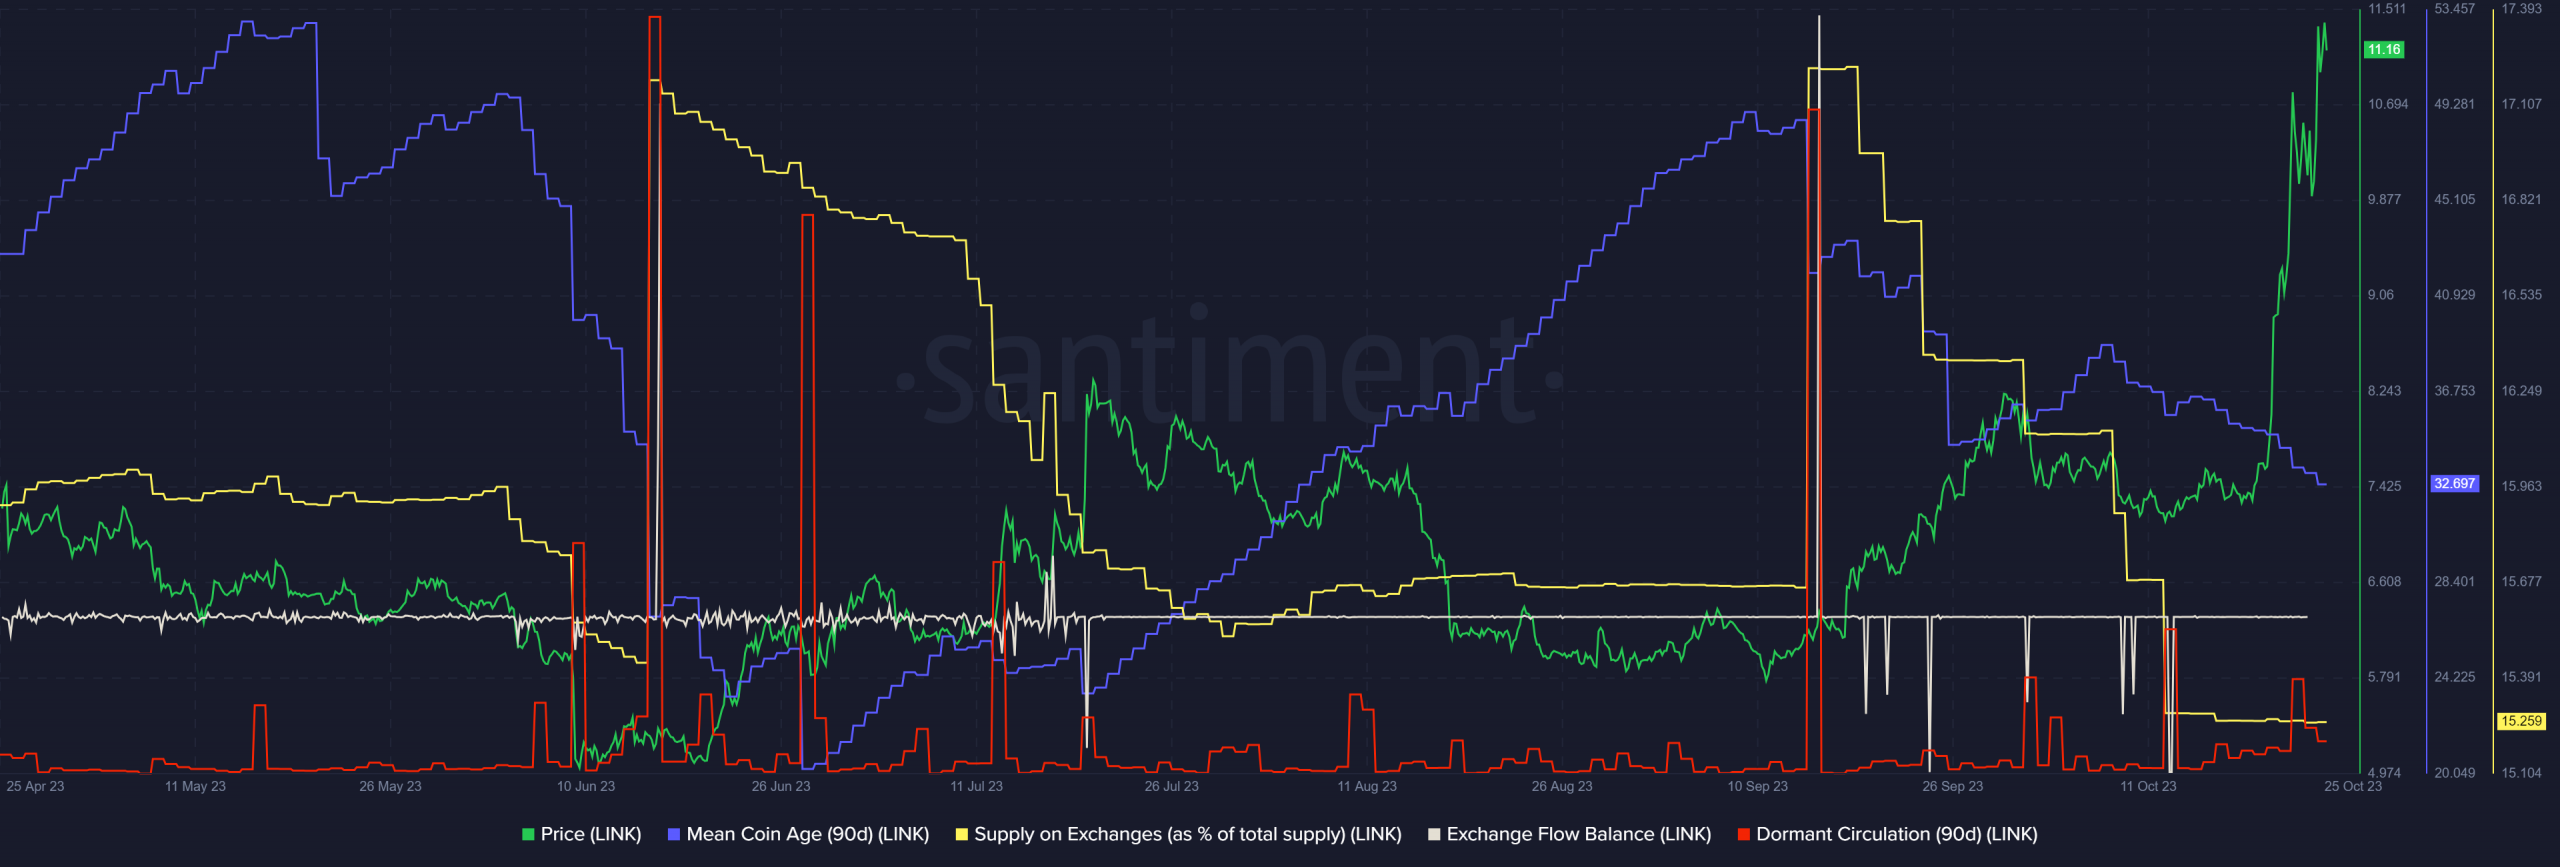
The Exchange Flow Balance metric saw large downward spikes in September, and the most recent one occurred on 13 October. The dormant circulation also soared higher on that day. Supply on exchanges also fell lower. The inference was that a large amount of LINK tokens were moved off exchanges and into cold storage.
How much are 1, 10, or 100 LINK worth today?
Yet, the Mean Coin Age trended lower since mid-September, which contradicts the inference made above. Instead, this metric showed some selling pressure persisted in the market despite recent gains.
Therefore long-term holders could be booking some profit on the recent breakout, which meant LINK could see a correction in the coming days or weeks.


