Litecoin: Assessing the odds of LTC sustaining its ongoing bull rally
- LTC’s MVRV Ratio spiked considerably over the past few days
- However, a few market indicators were bearish
Litecoin [LTC] managed to outperform most cryptos lately, as it registered over 9% gains in just 24 hours. This was a promising uptick that increased the possibility of a further increase in its price over the coming days.
Interestingly, DYOR.net, a crypto analysis platform, recently posted a tweet that revealed that Litecoin was on the list of the top five bullish trends on the BTC pair.
[Scan results – #Binance – 15m]
Top 5 bullish trends on $BTC pair
1: $PIVX
2: $ICP
3: $LTC
4: $OAX
5: $APETop 5 bullish trends on $USDT pair
1: $WTC
2: $LTC
3: $BAL
4: $APE
5: $LRCAll Binance results: https://t.co/NE27I4BsNN
Not buy signals. #DYOR— DYOR.net – Crypto Market Scanner (@DyorNetCrypto) December 5, 2022
Read Litecoin’s [LTC] Price Prediction 2023-2024
According to CoinMarketCap, LTC’s price surged over 16% in the past week. At press time, it was trading at $83.33 with a market capitalization of $5,979,961,633.
On-chain data further showed the number of Litecoin wallet addresses continued to grow at a steady pace. The year started from about 117 million wallets to 162 million at the time of writing.
On-chain data shows the number of #Litecoin wallet addresses continues to grow at a steady pace. From the beginning of the year, the number was approximately 117 million wallets. Now, there are 162 million LTC wallets and growing. 🚀🚀 pic.twitter.com/HcLFO8cPja
— Litecoin Foundation ⚡️ (@LTCFoundation) December 4, 2022
Nonetheless, things might turn around soon, as a few on-chain metrics suggested that LTC’s price might fall victim to a plummet in the days to follow.
Is Litecoin out of the woods yet?
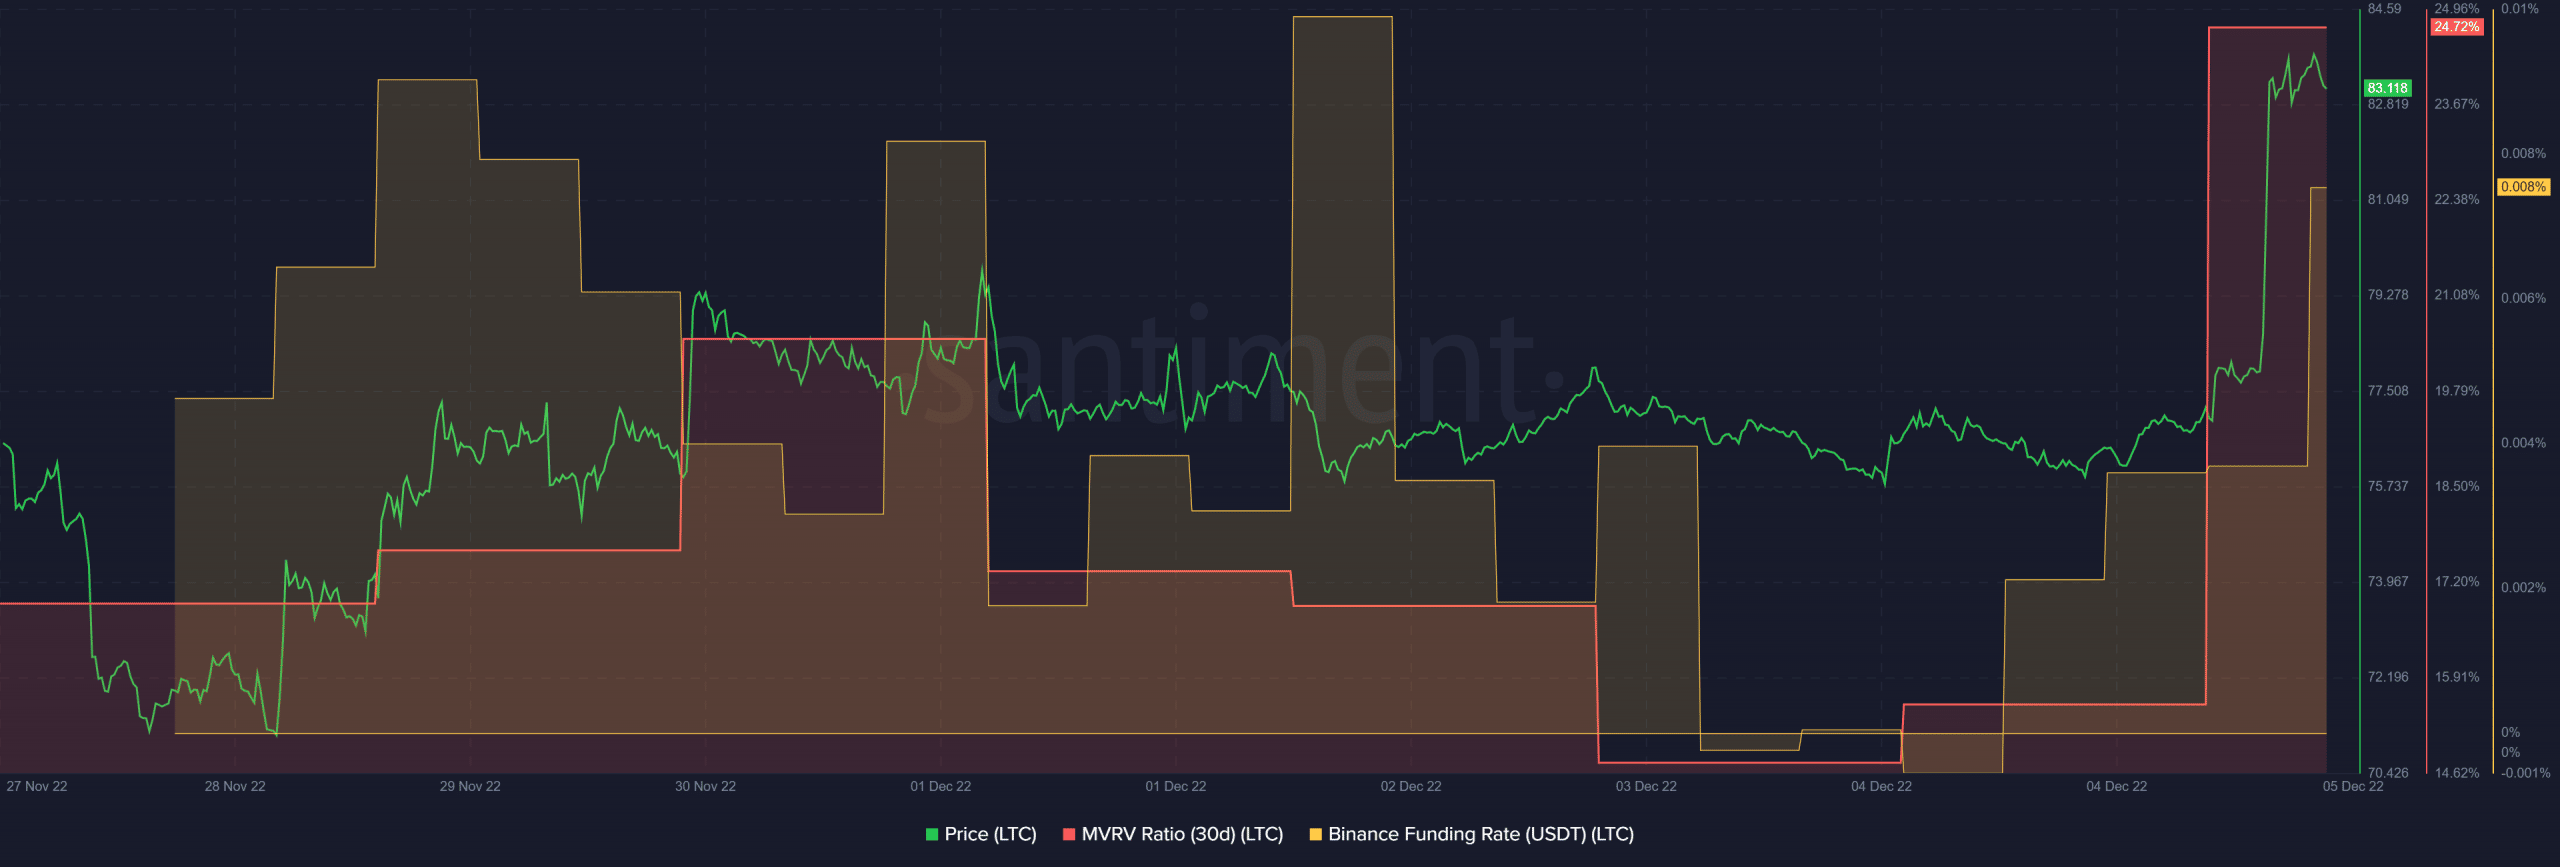
Santiment’s chart revealed that LTC’s Market Value to Realized Value (MVRV) ratio increased substantially over the past week. This development might indicate a possible market peak, followed by a price decline.
LTC’s Binance funding rate also went down during the last seven days. This pointed towards less traction from the derivatives market.
Furthermore, LTC’s transaction count declined sharply on 4 November. Litecoin’s velocity also followed a similar route and registered a decline, which can be concerning for the coin.

Have the bears entered?
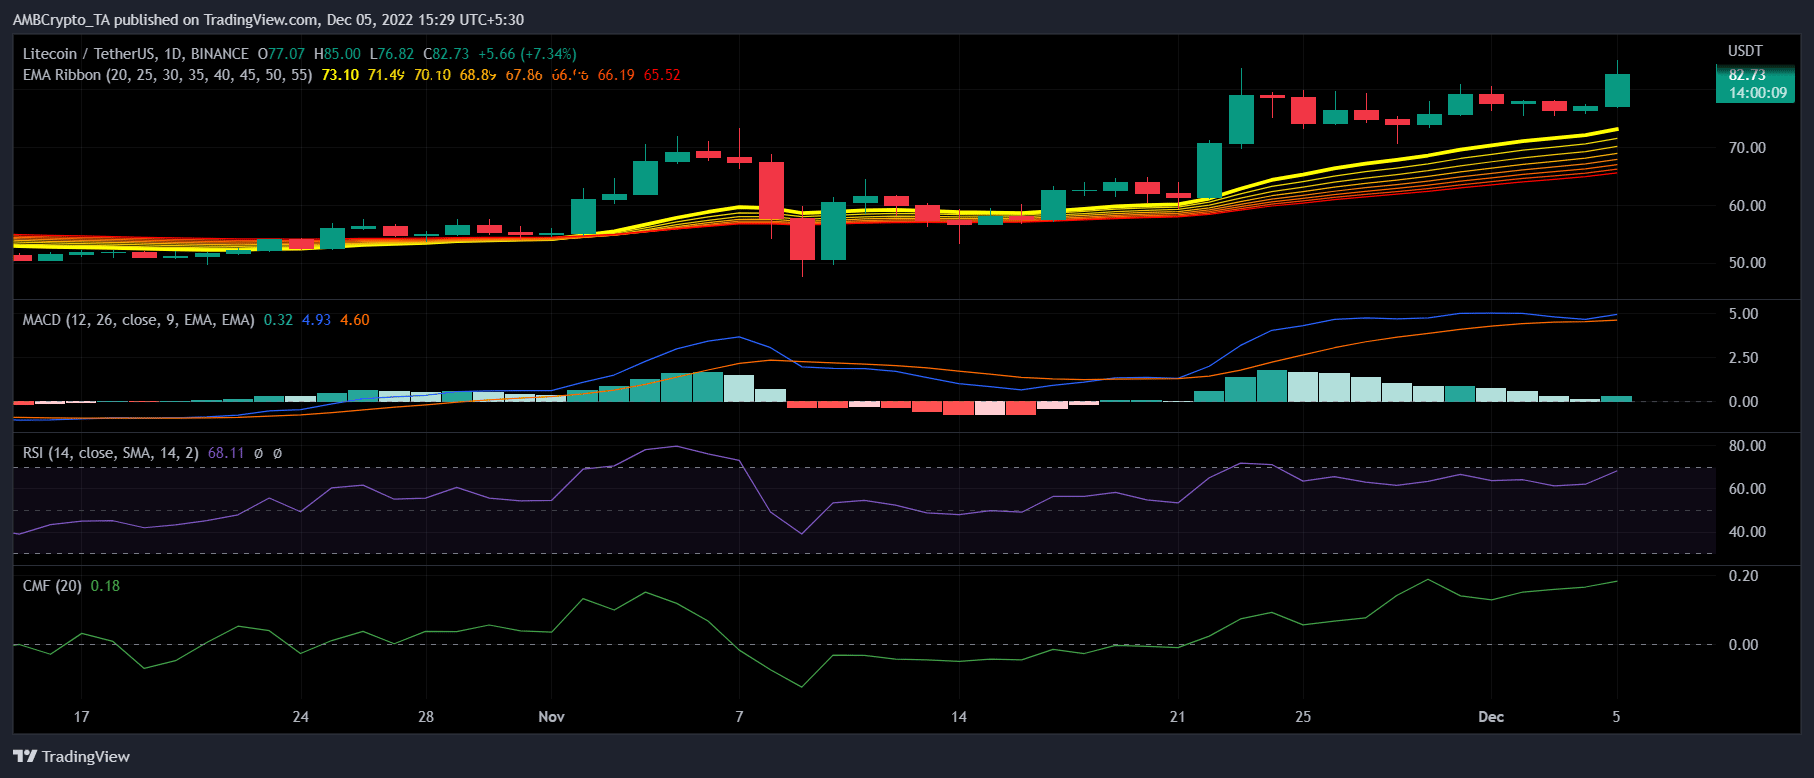
A look at LTC’s daily chart revealed that the bulls were leading the market, but it also suggested the possibility of a trend reversal. For instance, LTC’s Relative Strength Index (RSI) was entering the overbought zone, which is a massive bearish signal. Its Moving Average Convergence Divergence (MACD) indicated that the bulls and the bears were in a tussle.
Nonetheless, the Exponential Moving Average (EMA) ribbon delivered some good news, as the 20-day EMA was above the 55-day EMA. The Chaikin Money Flow (CMF) also registered an uptick, which looked optimistic for Litecoin.