Litecoin, Binance Coin, Chainlink Price Analysis: 01 June

Litecoin and Chainlink were yet to break above key resistance areas but bullish strength was accumulating in their markets. Up the crypto ladder, Binance Coin required to flip 38.2% Fibonacci level ($402) to initiate a price rally.
Litecoin [LTC]

A look at Litecoin’s daily chart showed that selling pressure was yet to fully dissipate in the market. However, its technicals have been building up a bullish narrative. While LTC has not been able to break above $211-240 just yet, the price has been forming higher lows. MACD line has gradually inched closer to Signal line and a successful crossover would highlight a potential shift in trend.
Awesome Oscillator was still below the half-line but it did notice some periods of buying pressure. A bullish twin peak would heighten the chances of an incoming price swing.
Binance Coin [BNB]
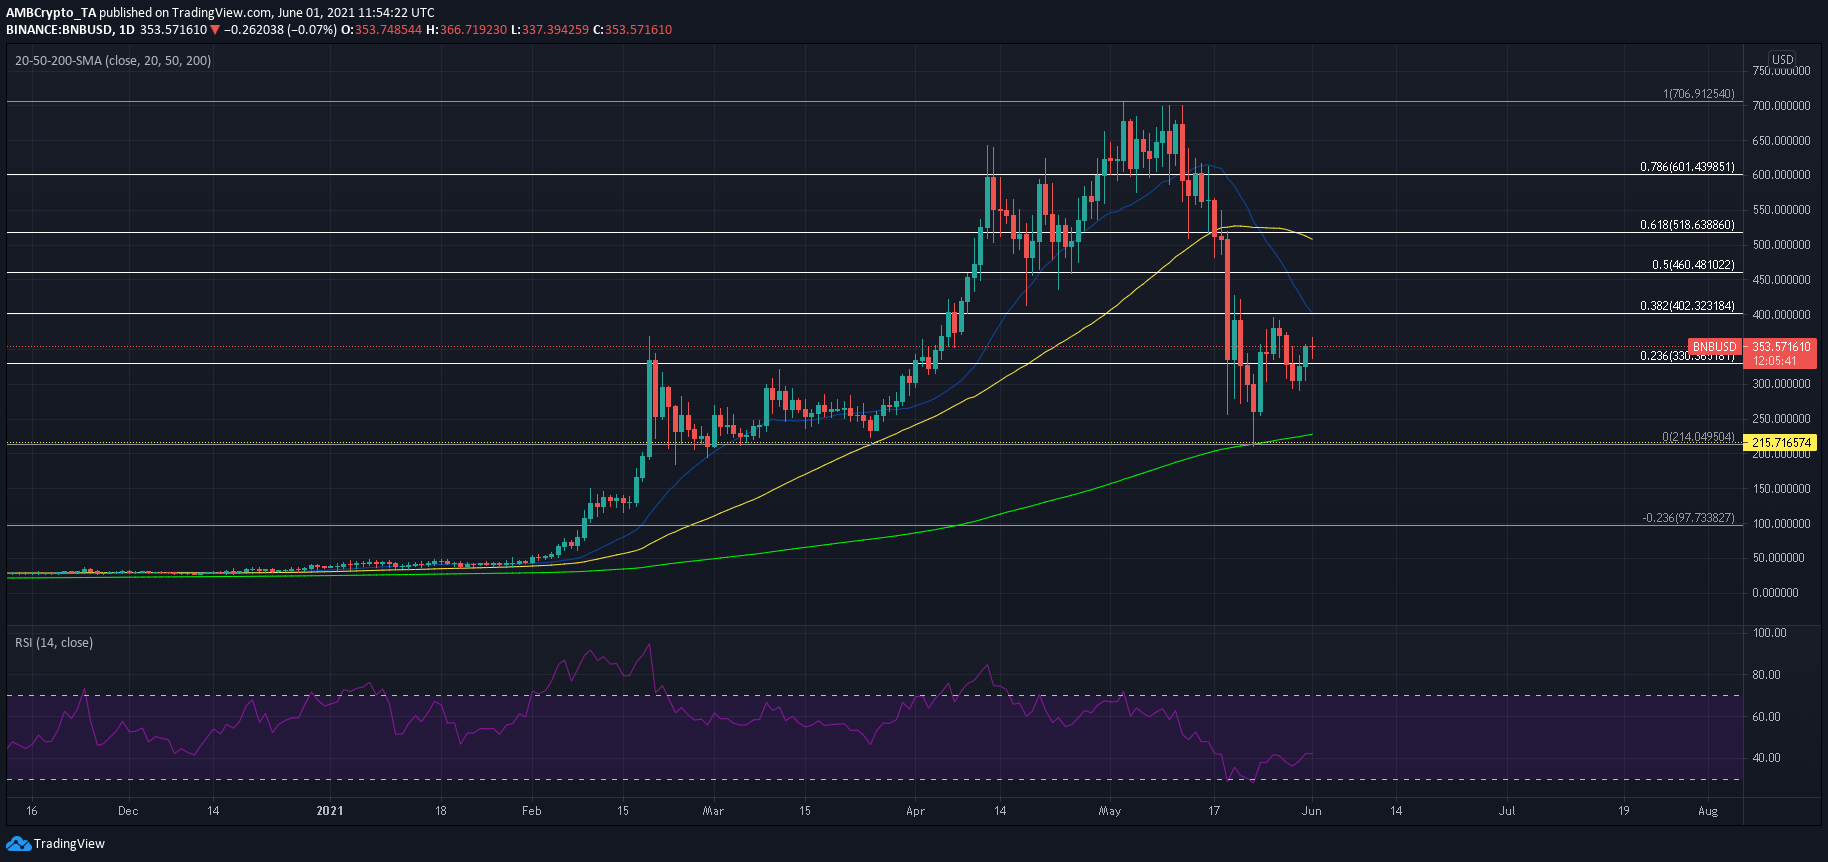
Fibonacci tool was used to identify key resistance levels for Binance Coin’s road to recovery. The 38.2% Fibonacci level ($402), which coincided with 20-SMA (red) was an important area to reclaim for the bulls. Such a development could also trigger a 30% price hike towards the 50% level ($460.48). In case of a dip, the newly flipped 23.6% level could provide some support.
RSI bounced back from the oversold zone and could reset around 50 before entering bullish territory. During this time, BNB could see some sideways movement below $400.
Chainlink [LINK]

The 4-hour chart on Chainlink recorded bullish movement over the last 24 hours but the price was unable to break above $32.5-resistance.This was largely expected as the region between $30 and $35.6 had been identified as a major resistance zone in an earlier analysis. Moreover, buying pressure had not accumulated for a breakout just yet. However, bulls were making progress according to Awesome Oscillator.
OBV’s uptrend also suggested that buying pressure was on the rise. Considering these factors, a breakout above $32.5 upper ceiling can be expected over the coming days.


