THETA, Chainlink, Uniswap Price Analysis: 31 May

THETA’s rally lacked conviction to break above $8.14-resistance. Chainlink remained below its EMA Ribbons and finally, Uniswap headed north towards strong resistance zones between $29.6 and 32.6.
THETA
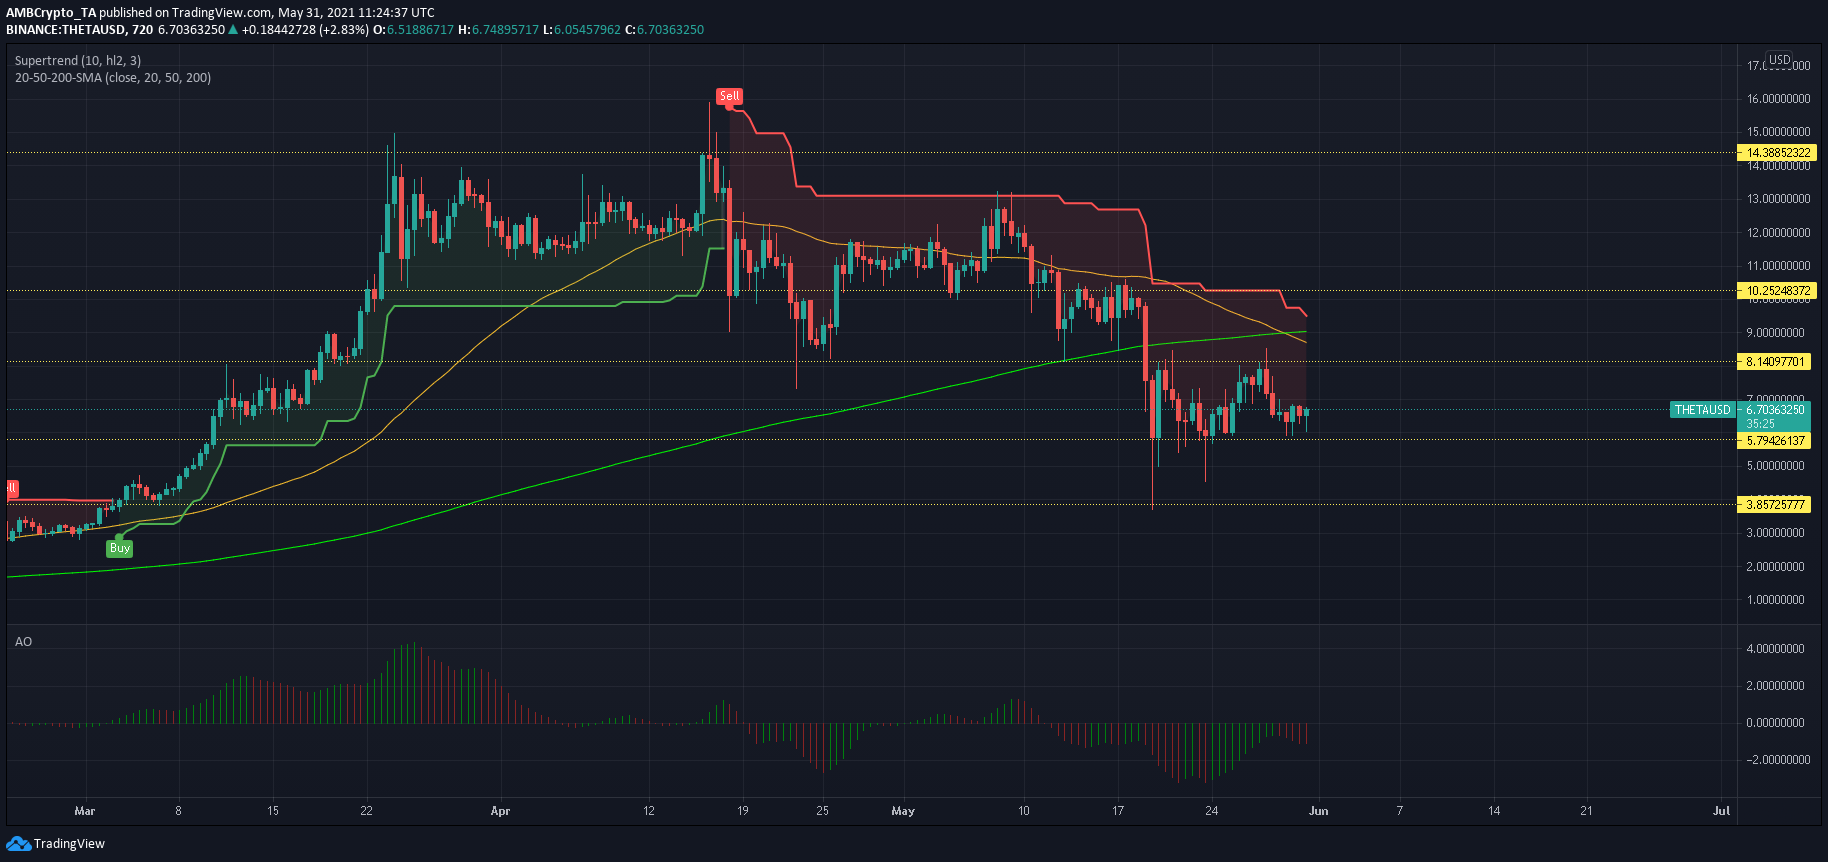
Supertrend Indicator on THETA flashed a ‘sell signal’ at the current price. This was hardly a surprise as bear market conditions were still evident on THETA’s 12-hour timeframe. The candlesticks traded below their 200-SMA (green) and remained restricted below a key resistance mark at $8.14. A series of red bars on Awesome Oscillator indicated that bearish pressure was also still prevalent.
A break below $5.79 could allow for a retest of $3.85 support. However, maintaining $5.79 could allow for a bullish outcome over the coming days.
Chainlink [LINK]

EMA Ribbons on Chainlink’s 12-hour chart identified a strong resistance zone between $30 and $35.5. During LINK’s most recent rally, the price was rejected at the upper end of this zone and saw downward movement. The diverging nature of these bands also indicated that a strong bearish trend was still in play. If these bands cross moving forward, expect a flip of market dynamics.
Even though MACD’s fast-moving line was above the Signal line and reflected some bullish resurgence, the index was yet to recover above half-line. For a faster recovery, LINK needed to reclaim the area above $35.4-resistance.
Uniswap [UNI]
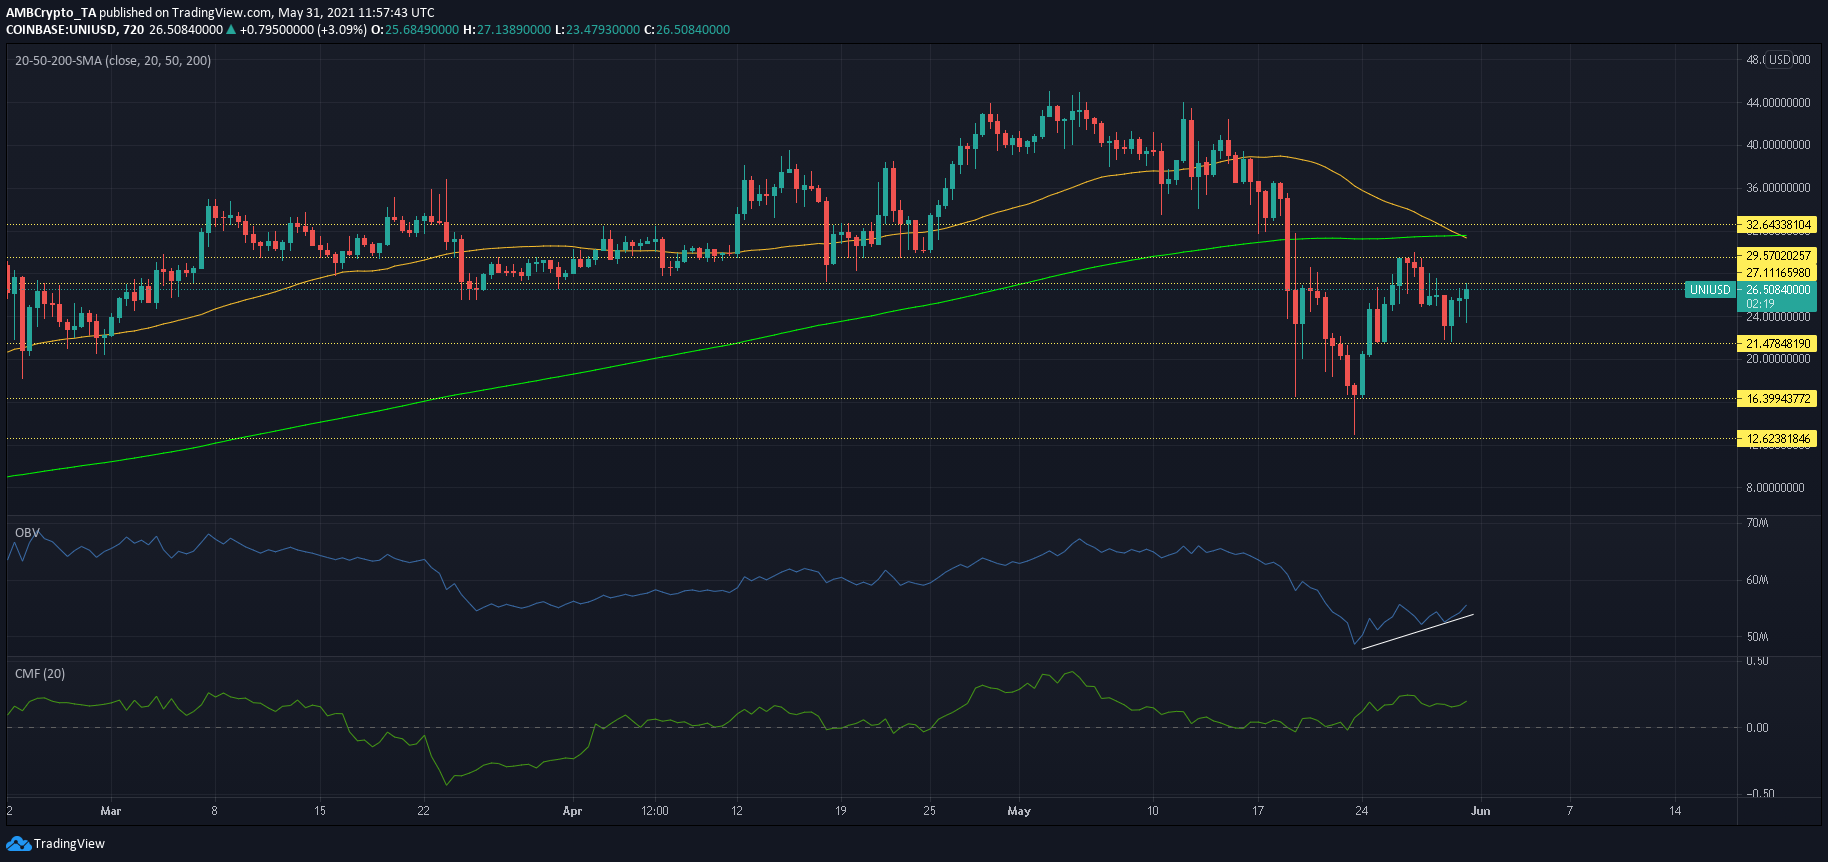
Uniswap reversed its trajectory after touching $21.4-support and moved north at the time of writing. Its value surged by 9% over the last 24 hours but several obstacles lay ahead for the cryptocurrency. A strong resistance area resided between $29.6 and $32.6. This zone showed a confluence between 200-SMA (green) and 50-SMA (yellow) as well. Moreover, trading volumes across exchanges were yet to reach $1 Billion, a sign that UNI’s jump lacked momentum to trend at higher levels.
While OBV’s higher lows suggested that buying pressure was on the rise, it was not supportive of a breakout just yet. According to Chaikin Money Flow, capital inflows still remained healthy for UNI. These were signs of a gradual recovery.


