Litecoin, Bitcoin Cash and MATIC Price Analysis: 2 June

As Bitcoin traded below the $38,000 mark, it saw a small price hike of 2.5% in the last 24 hours. The crypto market cap was up by almost 15% in the last three days paving way for the slow recovery of altcoins like MATIC, Bitcoin Cash, and Litecoin. These alts saw a restricted price movement as they clung close to their key support marks.
MATIC
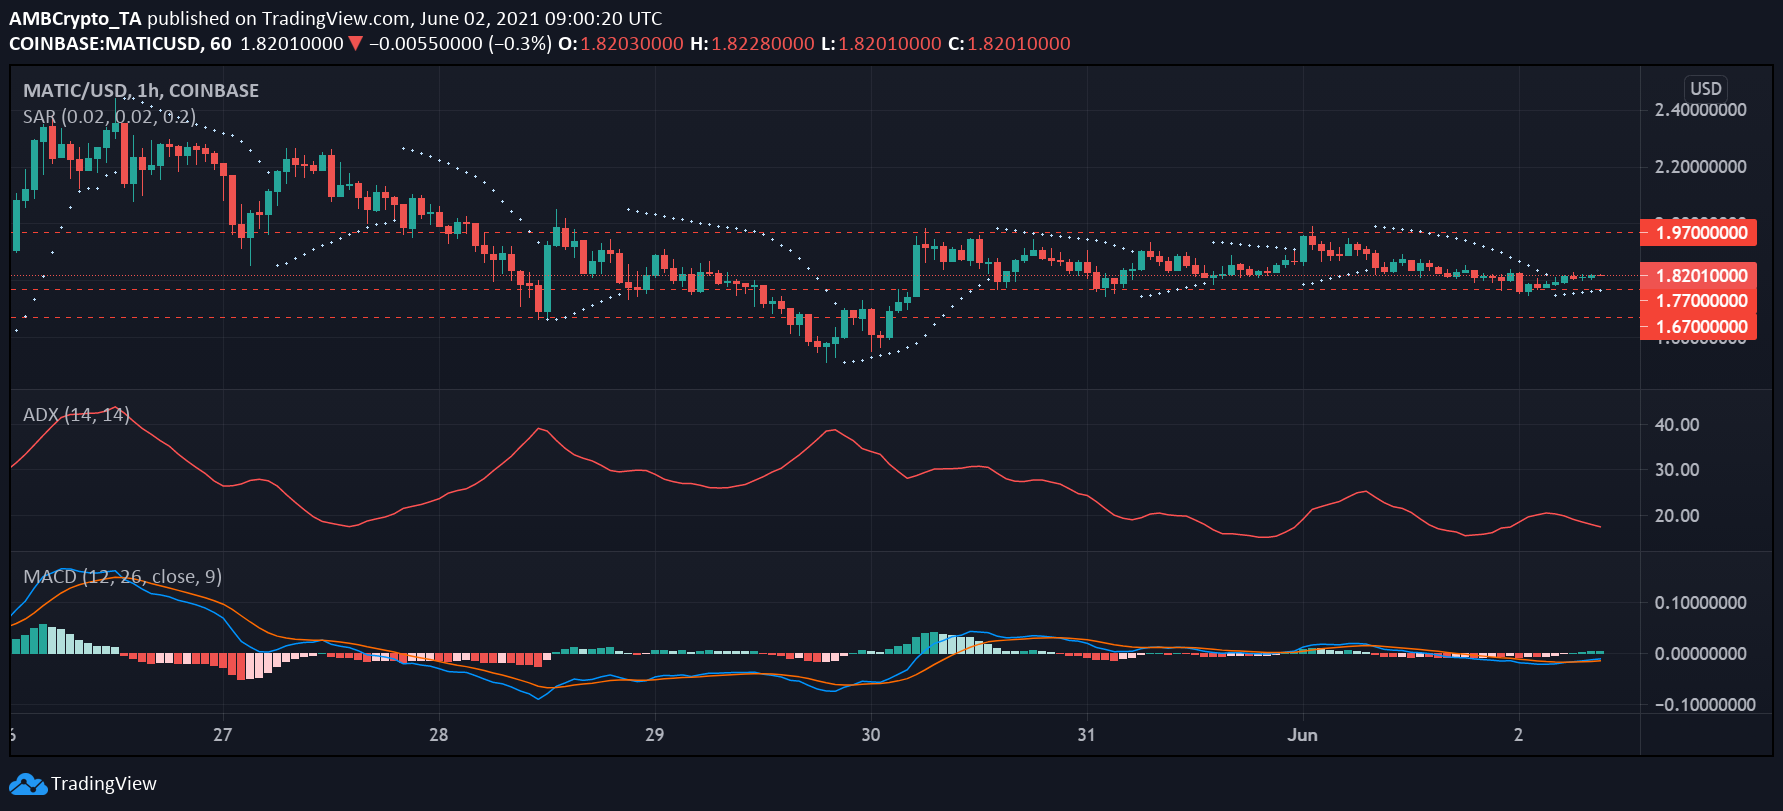
At press time, MATIC traded at $1.8 and was down 29.21% from its all-time-high. The asset saw a 24-hour price dip of 2.40%.
Since June 1, MATIC’s price was fluctuating between $1.97 resistance and $1.77 support levels. At the time of writing, Parabolic SAR depicted dotted lines below the candlesticks highlighting a bullish trend. This was further supported by MACD lines, which depicted a slightly bullish crossover; however, MACD lines were still closely intertwined with the signal line at the time of writing.
Moreover, ADX’s downward trend further indicated that the market was becoming less directional. While this could mean that an upward price trend is in store for the asset, it’s better to watch the trend unfold than rushing in.
Bitcoin Cash
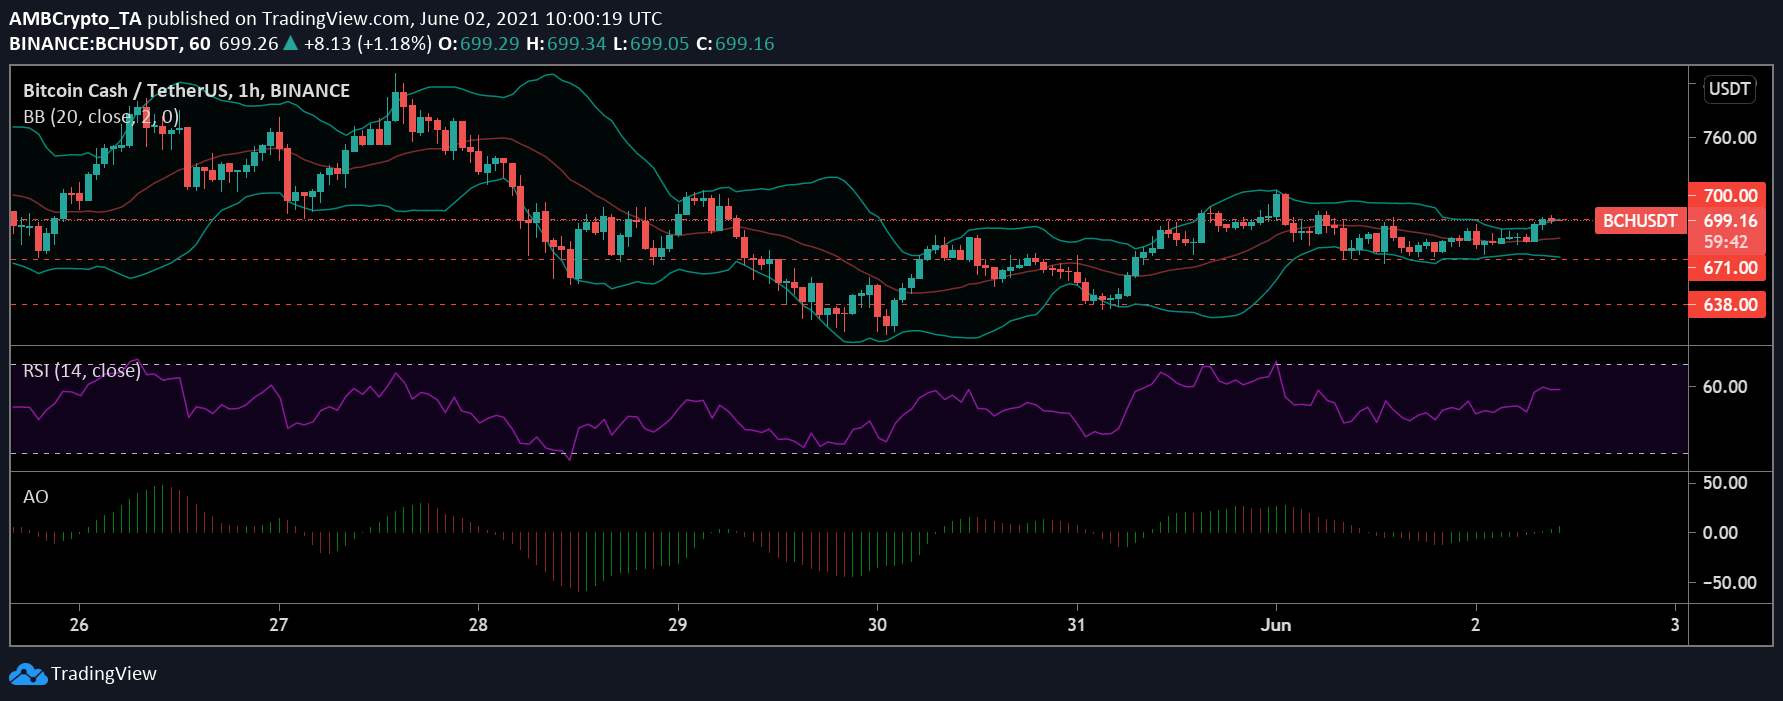
Bitcoin Cash traded at $701 at press time, the asset saw a 3.27% price hike in the past 24 hours and broke the $700 resistance mark at the time of writing. BCH had oscillated between the $671 support mark and the $700 resistance mark before testing its resistance at press time. The asset’s next resistance stands at the $720 mark.
The asset’s price range was largely confined between $671 and $700. The low market volatility trend was seen breaking as the diverged Bollinger bands showed signs of opening up which highlighted that the price range might become more expanded.
Relative strength index was fairly stable, slightly above the neutral zone and indicated dominant buying pressure over selling pressure. Moreover, Awesome oscillator showed that a slight bullish momentum had crept in after a short bearish trend.
Litecoin

Litecoin was down 55.58% from its all-time-high 23 days ago. The asset ranked 14 on CoinMarketCap and was trading at $184 at press time. Litecoin’s one-hour chart showed that its price was ranging between the $187 resistance and $176 support levels for the past few days.
Diverging Bollinger bands at press time showed signs of opening up, indicating that the price range might become more expanded. Further, Chaikin Money flow highlighted that capital inflows were slightly more than outflows keeping the indicator just above the zero-line. The minor uptick seen according to Chaikin Money flow may or may not suggest a trend reversal as the previous uptrend in the indicator had resulted in a sharp drop, giving rise to the new uptick, at press time.


