Litecoin, Bitcoin Cash, ETC, Stellar Price Analysis: 07 April

In the last 24 hours, the overall sentiment dragged itself back to the ‘fear’ zone. Consequently, Litecoin, Bitcoin Cash, Ethereum Classic and Stellar revealed an oversold 4-hour RSI. S0, a short-term revival from their immediate support seemed likely in the next few days.
Litecoin (LTC)

In its previous bullish rally, LTC grew in an ascending channel (white) on its 4-hour chart. This rally sprang after the alt matched its 14-month lows on 24 February. Meanwhile, the bulls found a barrier at the two-month resistance near the $131-mark.
Thus, a reversal from this mark caused an up-channel breakdown that pushed the alt below its 20/50/200 EMA. Now, a possible bearish crossover of the 20/200 EMA could propel a change in trend in favor of sellers.
At press time, LTC traded at $112.8. The RSI was deep into the oversold region at the 26-mark. So, a potential revival from this level would position LTC for a test of the $116-mark resistance.
Bitcoin Cash (BCH)
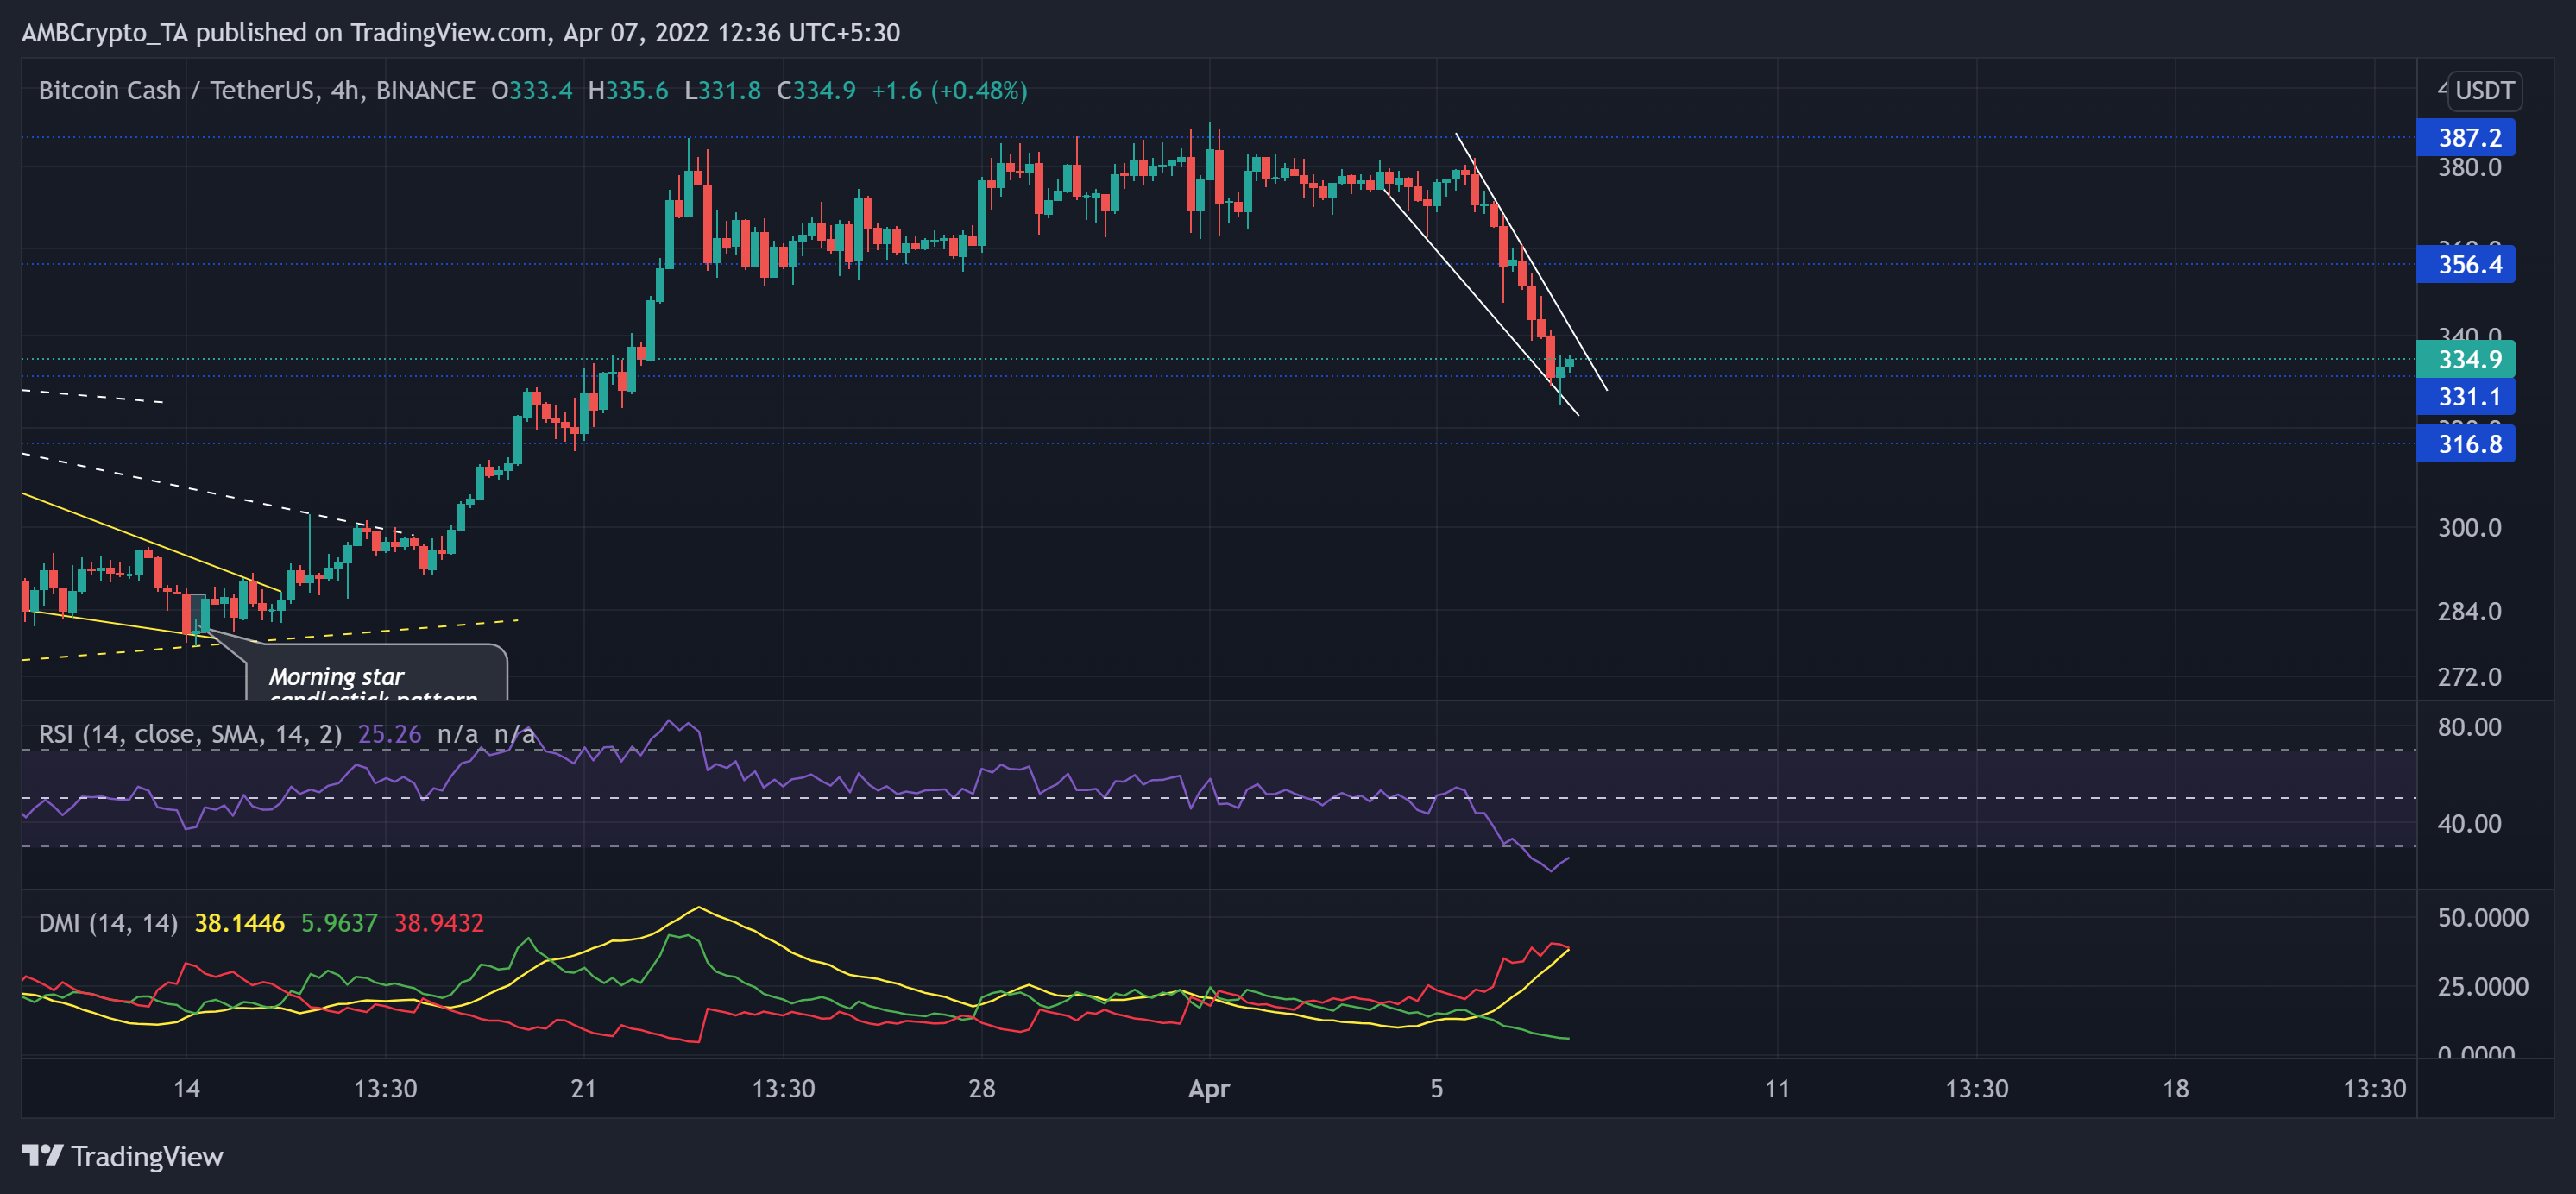
As the bullish phase heightened, BCH sharply rose to reclaim the lost $356-mark.
The latest retracement saw a falling wedge (white) that tested the $331-support. BCH lost over 12% of its value in the past two days. Any close upper trendline of the wedge can cause a patterned breakout towards the $356-level.
At press time, BCH traded at $334.9. The oversold RSI eyed to cross the 30 mark to enable any revival chances. The gap between the DMI lines had overstretched while the bears kept exerting pressure.
Ethereum Classic (ETC)
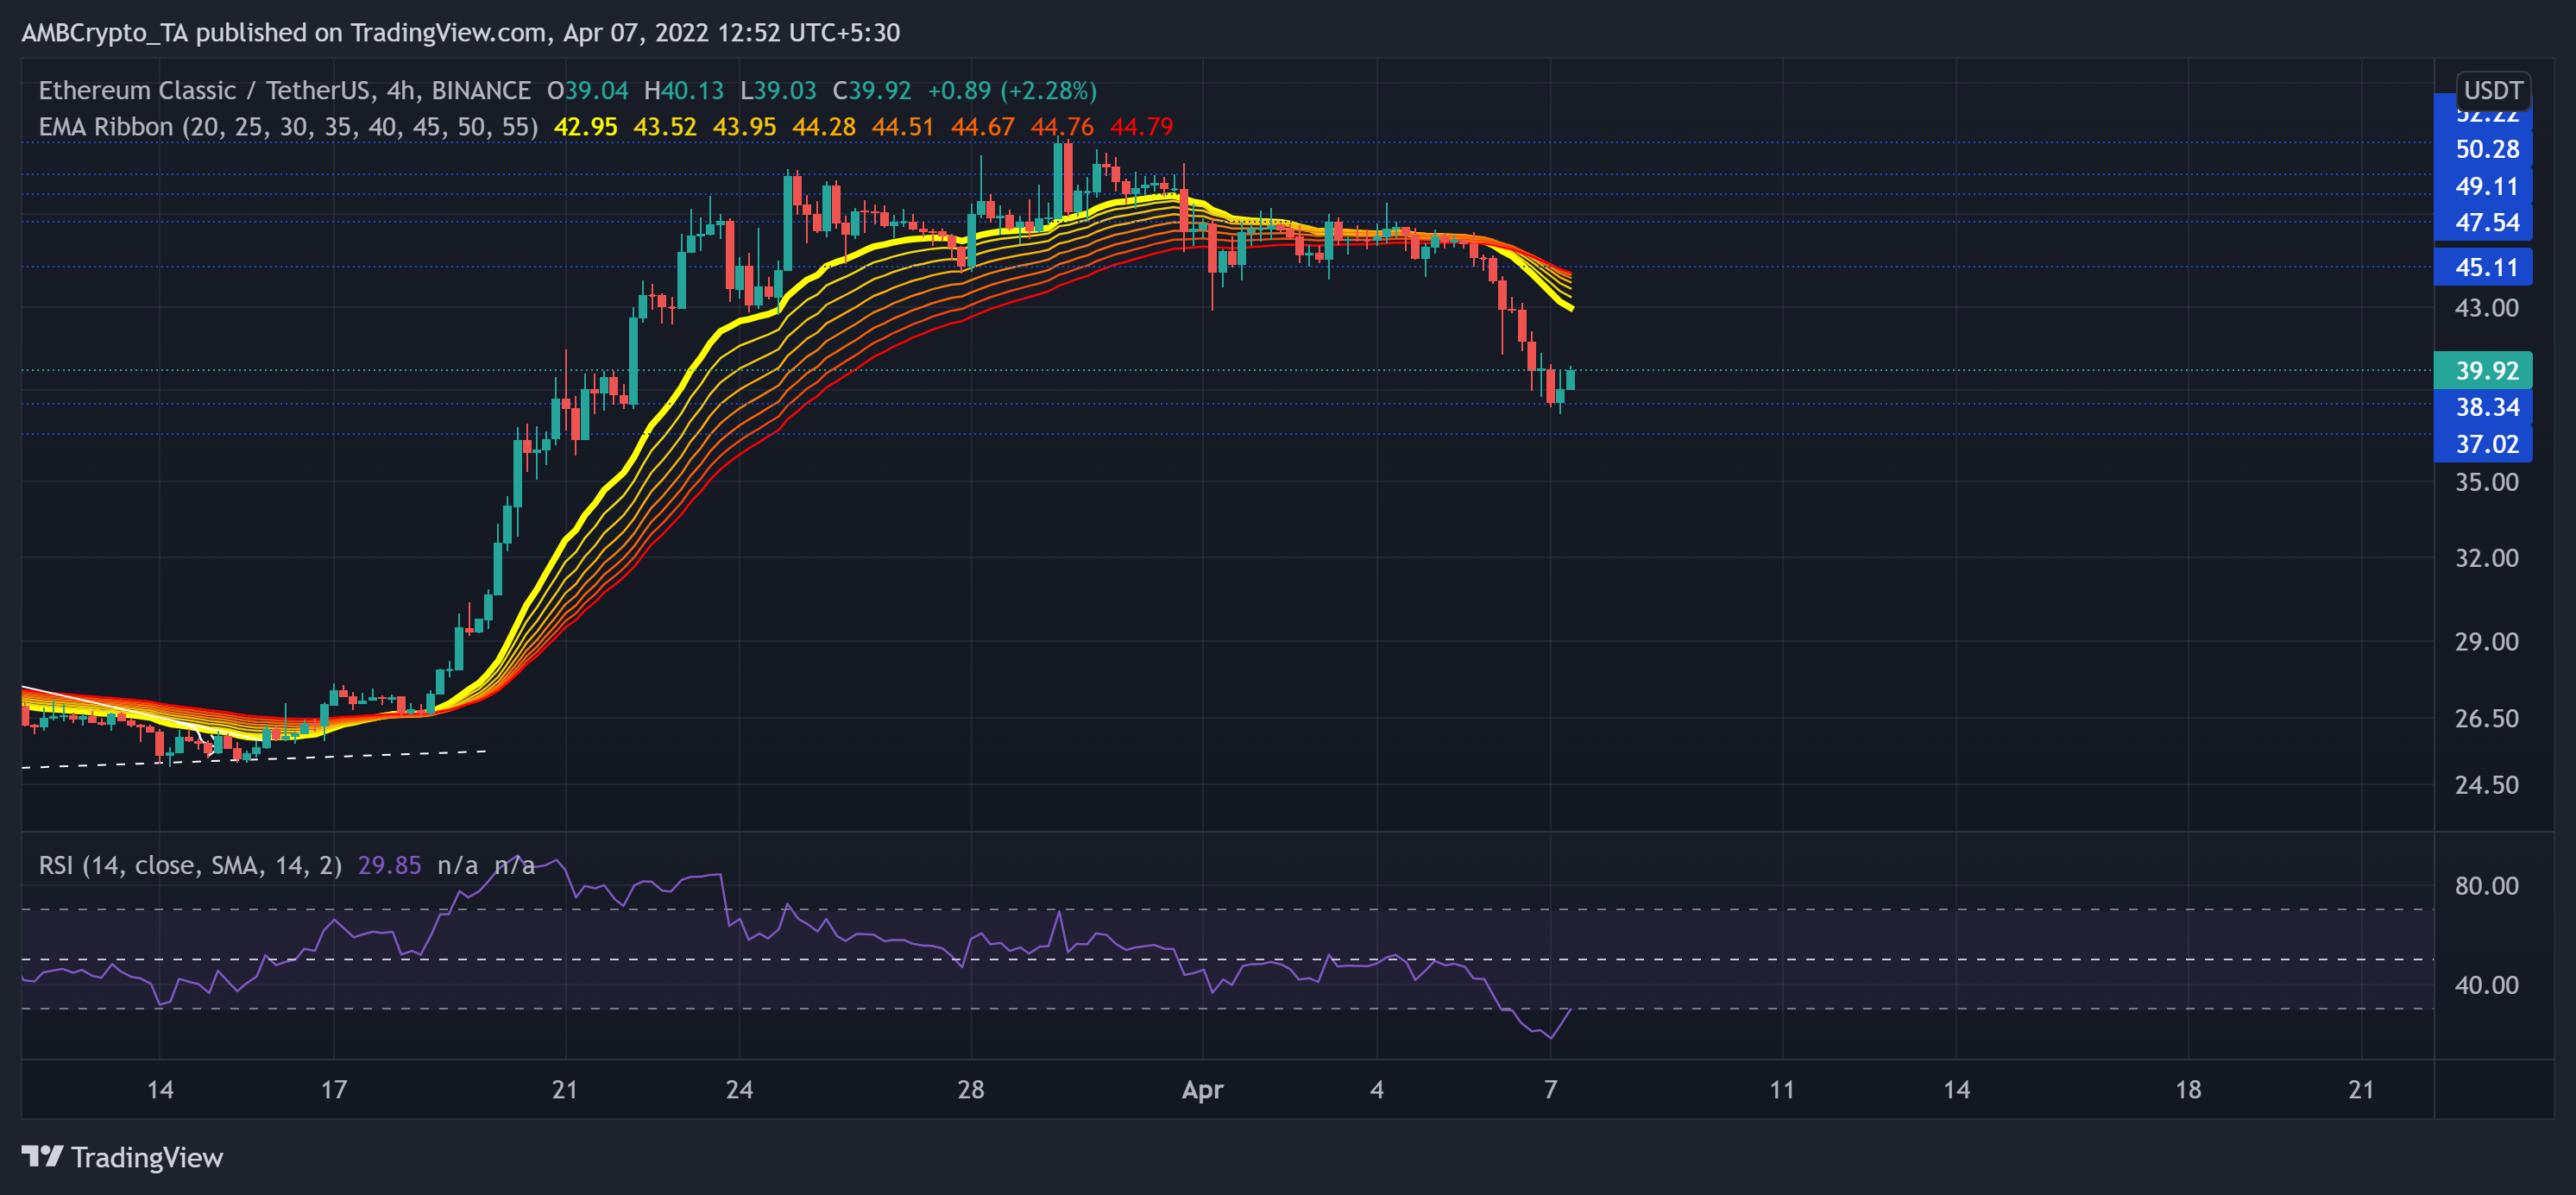
ETC lost more than a third of its value from its February highs and dropped to match its monthly low on its trendline support (white, dashed). Then, the bulls took over and propelled a 108.8% growth towards the $52.2-mark.
Since then, it has been in a plunge phase that led ETC below all its EMA ribbons. As these ribbons undertake a bearish flip, the bears visibly depicted their edge. At press time, ETC traded at $39.92. The bearish RSI recovered above the 30 mark on its way up from the oversold territory.
Stellar (XLM)
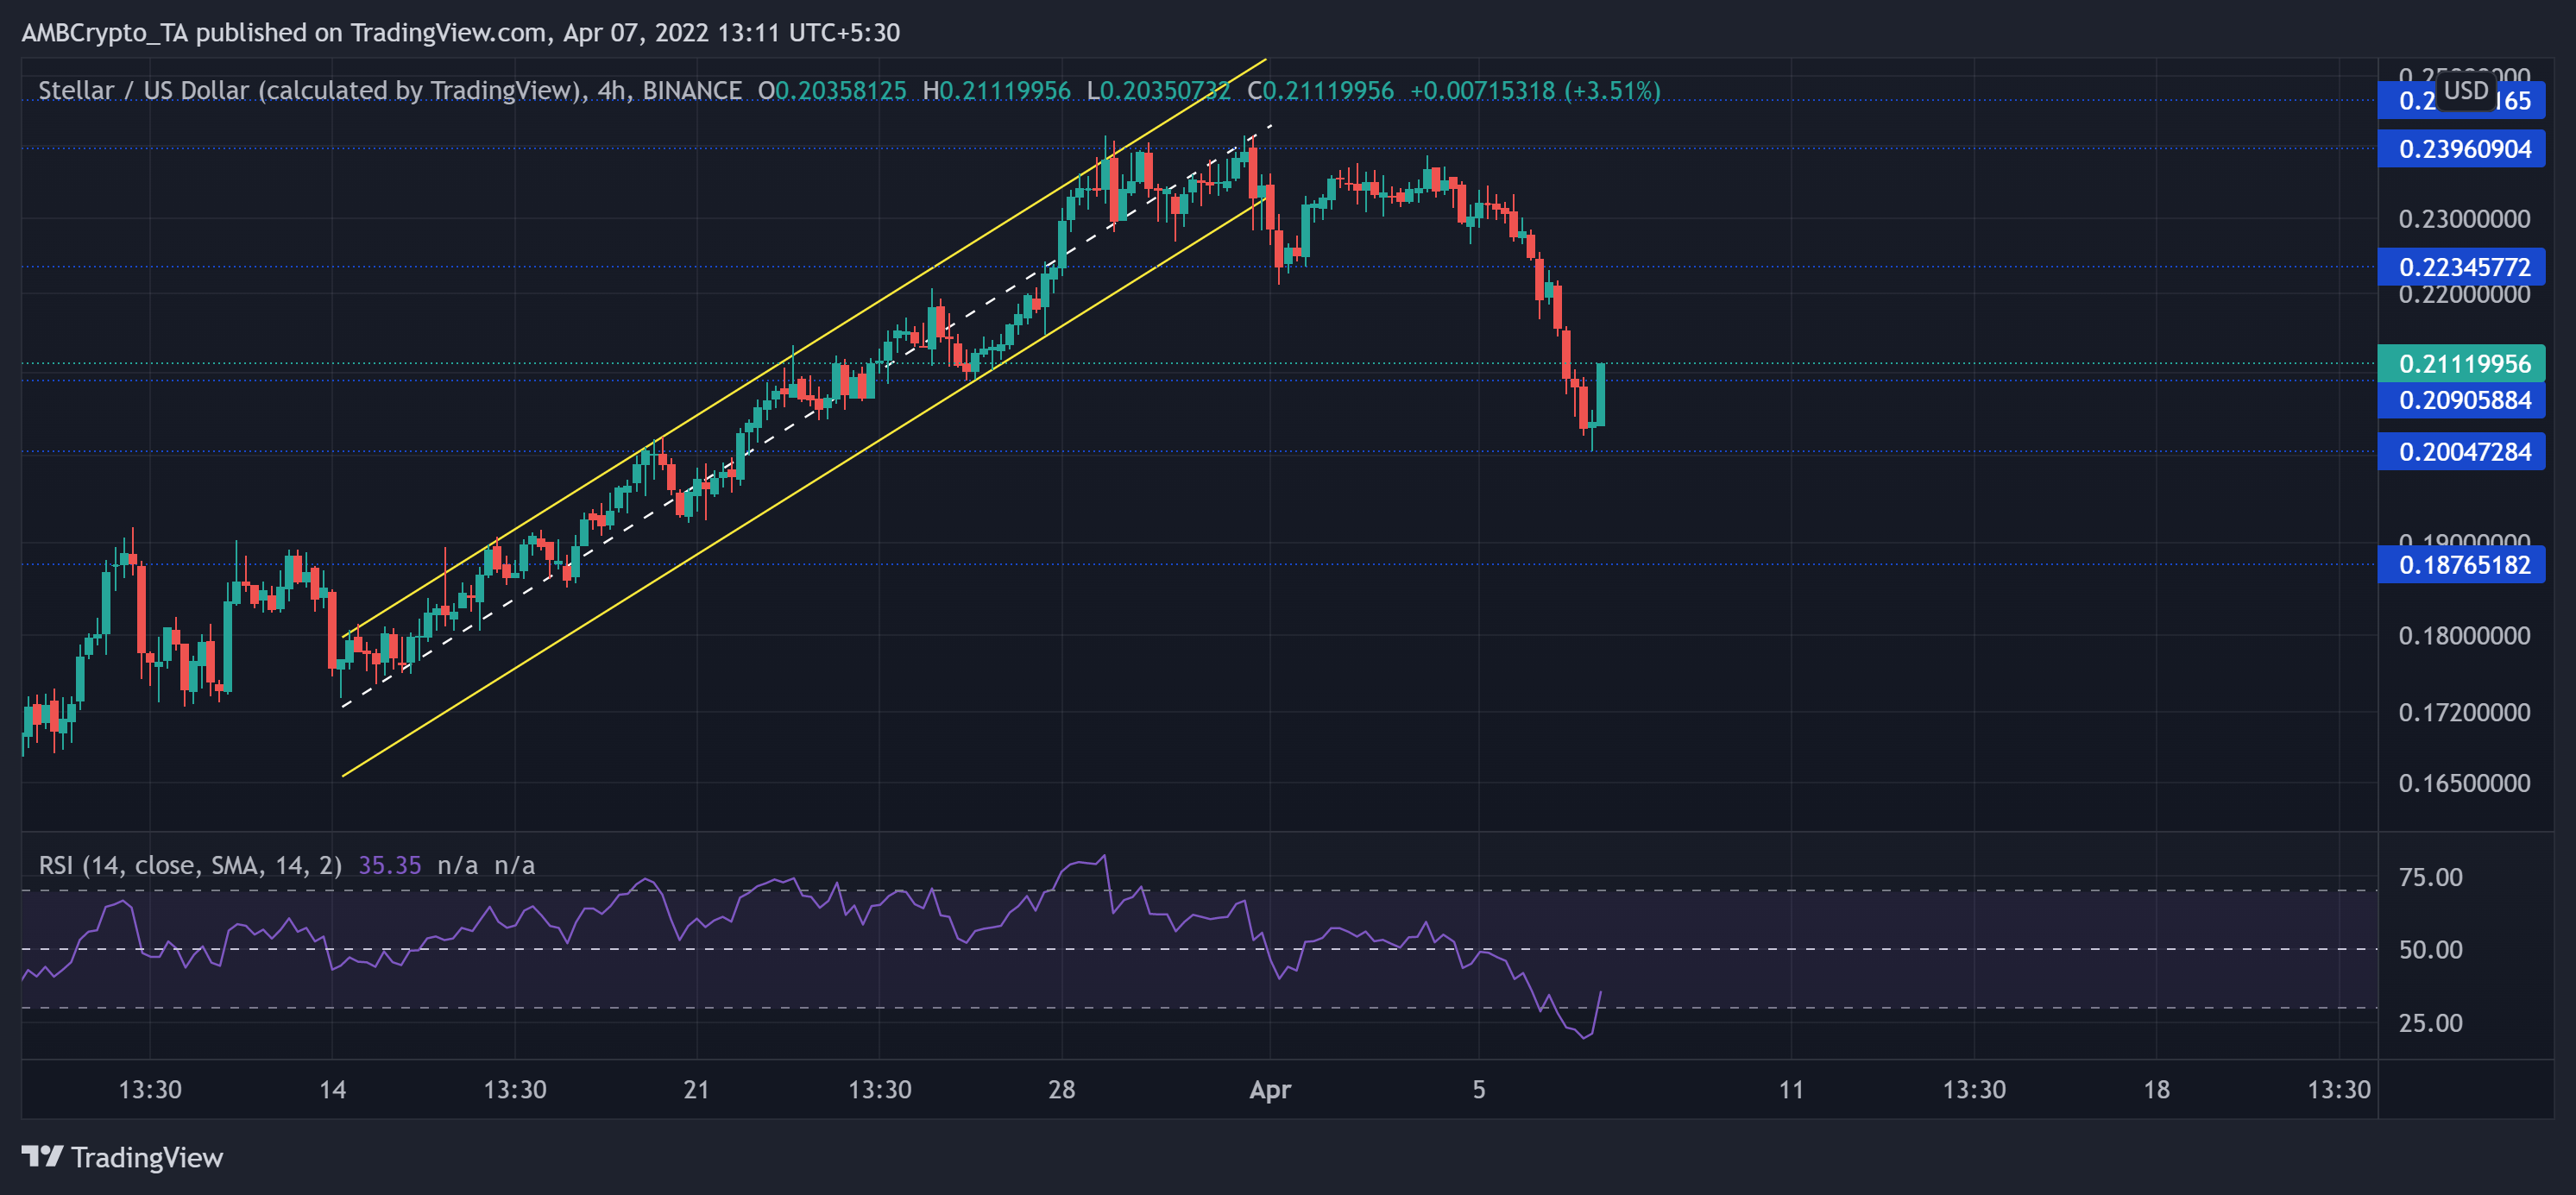
Ever since Stellar (XLM) struggled to overturn the $0.26 resistance, the alt swiftly declined towards its long-term support at the $0.16-level. Since then, in the last three weeks, XLM saw a solid up-channel rally that halted broke down from the $0.24-level. While the $0.2-mark stood sturdy, any close above or at the current level would affirm a morning star (bullish) candlestick pattern.
At press time, XLM traded at $0.211. Similar to previous altcoins, XLMs RSI reversed from the 19-mark as the bulls endeavored to test the $0.22-level.


