Litecoin, Crypto.com Coin, Dogecoin Price Analysis: 25 January

Bitcoin’s price continues to consolidate around the $33,000 price level and in the past few days, the same was seen in the altcoin market as well. For popular altcoins like Litecoin, Crypto.com Coin, and Dogecoin the past week saw their price action confined to a narrow range.
Litecoin [LTC]
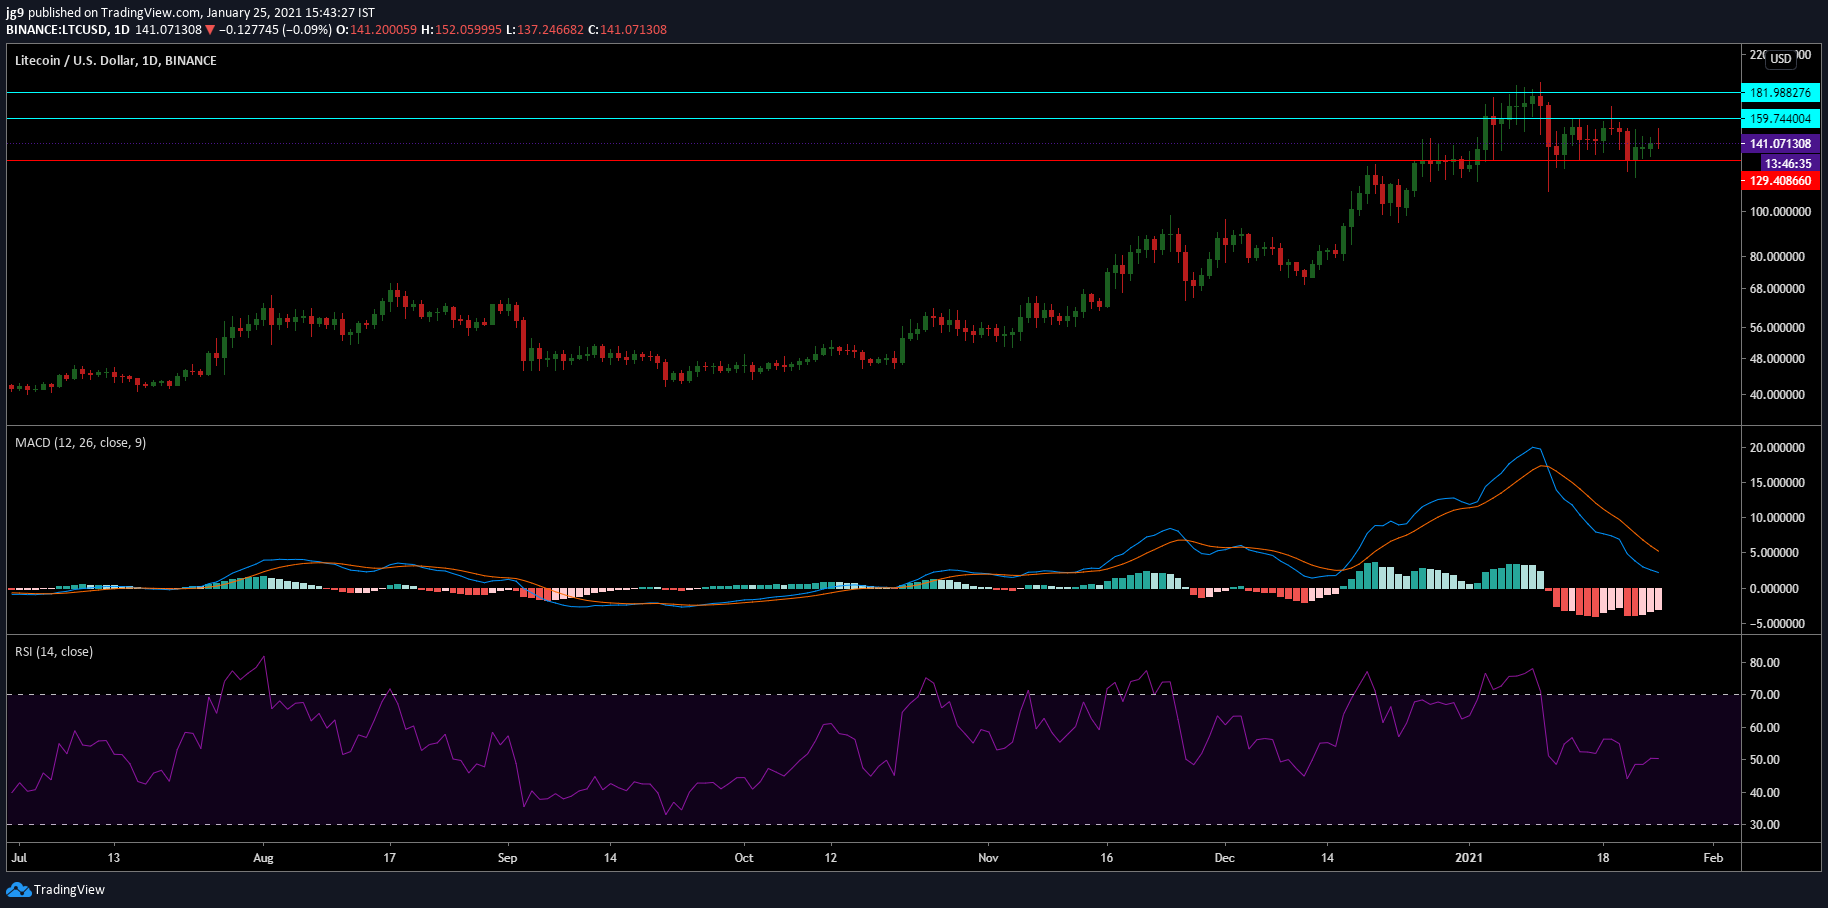
Litecoin witnessed a minor dip of over 1 percent in the past week. The coin currently trades at $140 and seems to have lost much of its bullish momentum. As per the 1-day chart of Litecoin, during the past week, the coin’s price traded primarily between its immediate resistance at $159 and support at $129. However, if the bulls were to take over, then LTC may also have to deal with the strong resistance around the $180 price range in order to fuel its ambitions of a new ATH.
The technical indicators such as the MACD indicator and the RSI are currently bearish. The MACD indicator has undergone a bearish crossover and a reversal doesn’t seem to be imminent. The RSI is also moving away from the neutral zone and into the oversold zone.
Crypto.com Coin [CRO]
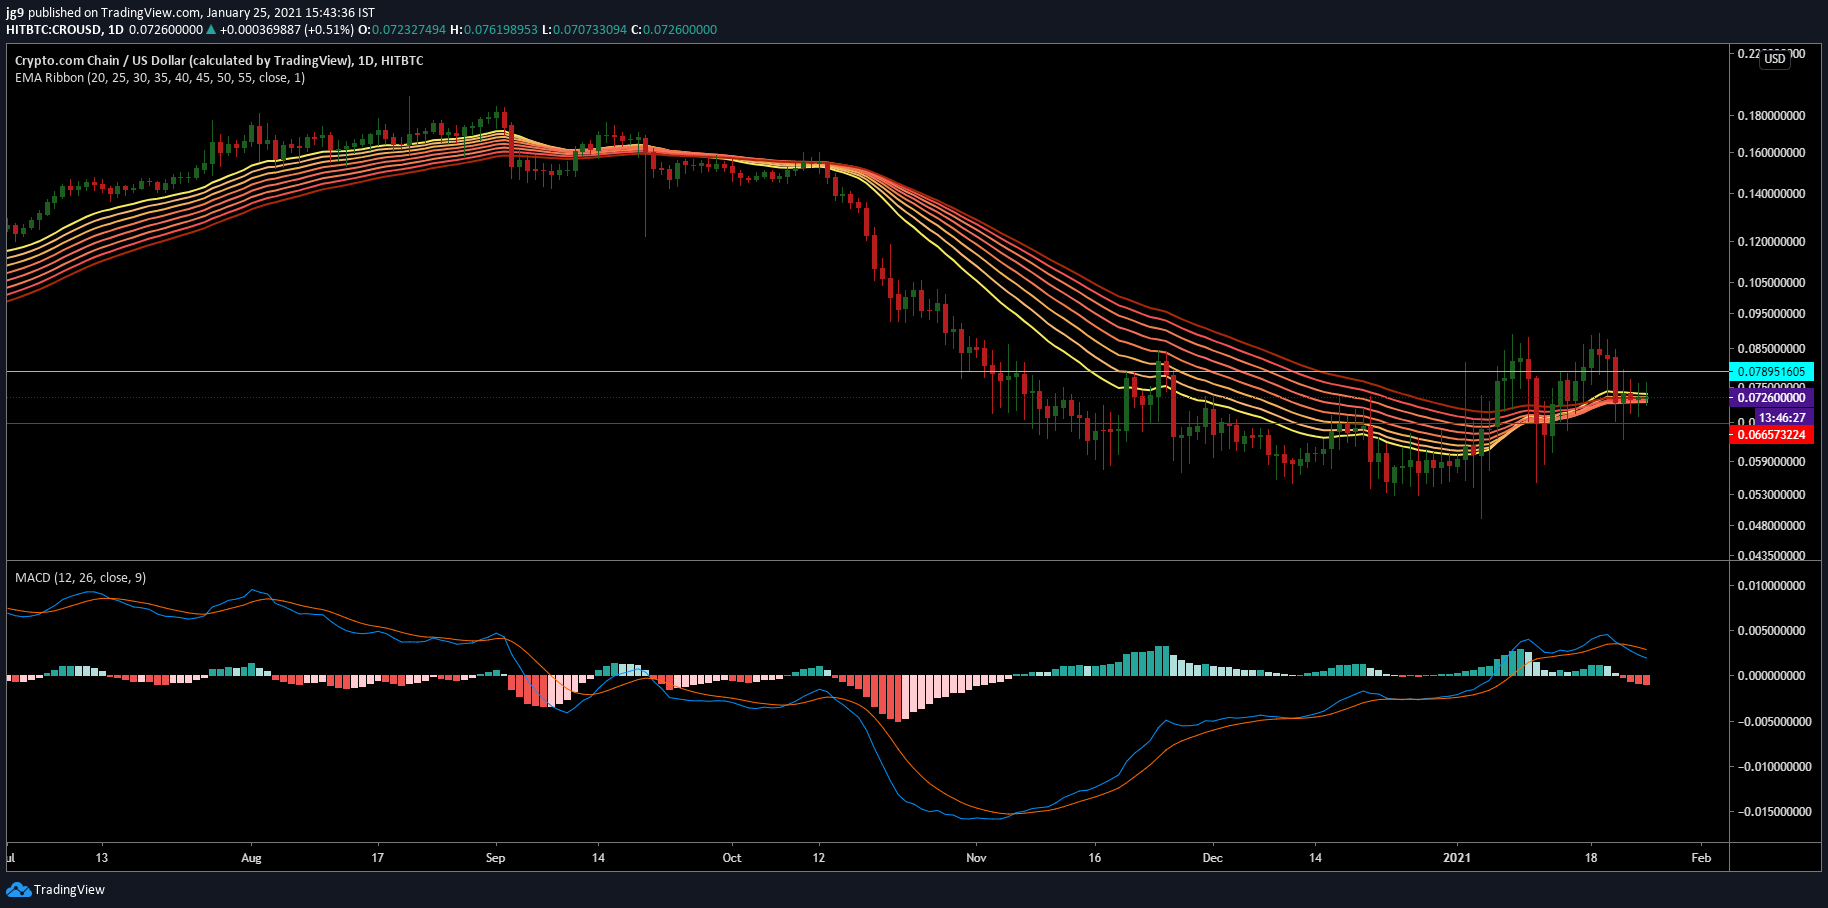
Crypto.com Coin fell by close to 10 percent in the past week. The coin currently trades at around $0.072 with a market cap of over $1.6 billion. However, the coin stabilized around the current trading price in the past few days and continues to move without much volatility. The coin has strong resistance around the $0.78 range and if the coin were to see another correction it can rely on the support at $0.066.
The EMA ribbons have settled right by the price and are likely to offer resistance unless CRO flips it into a support in the coming hours. The RSI indicator looks bearish after it moved into the oversold zone.
Dogecoin [DOGE]
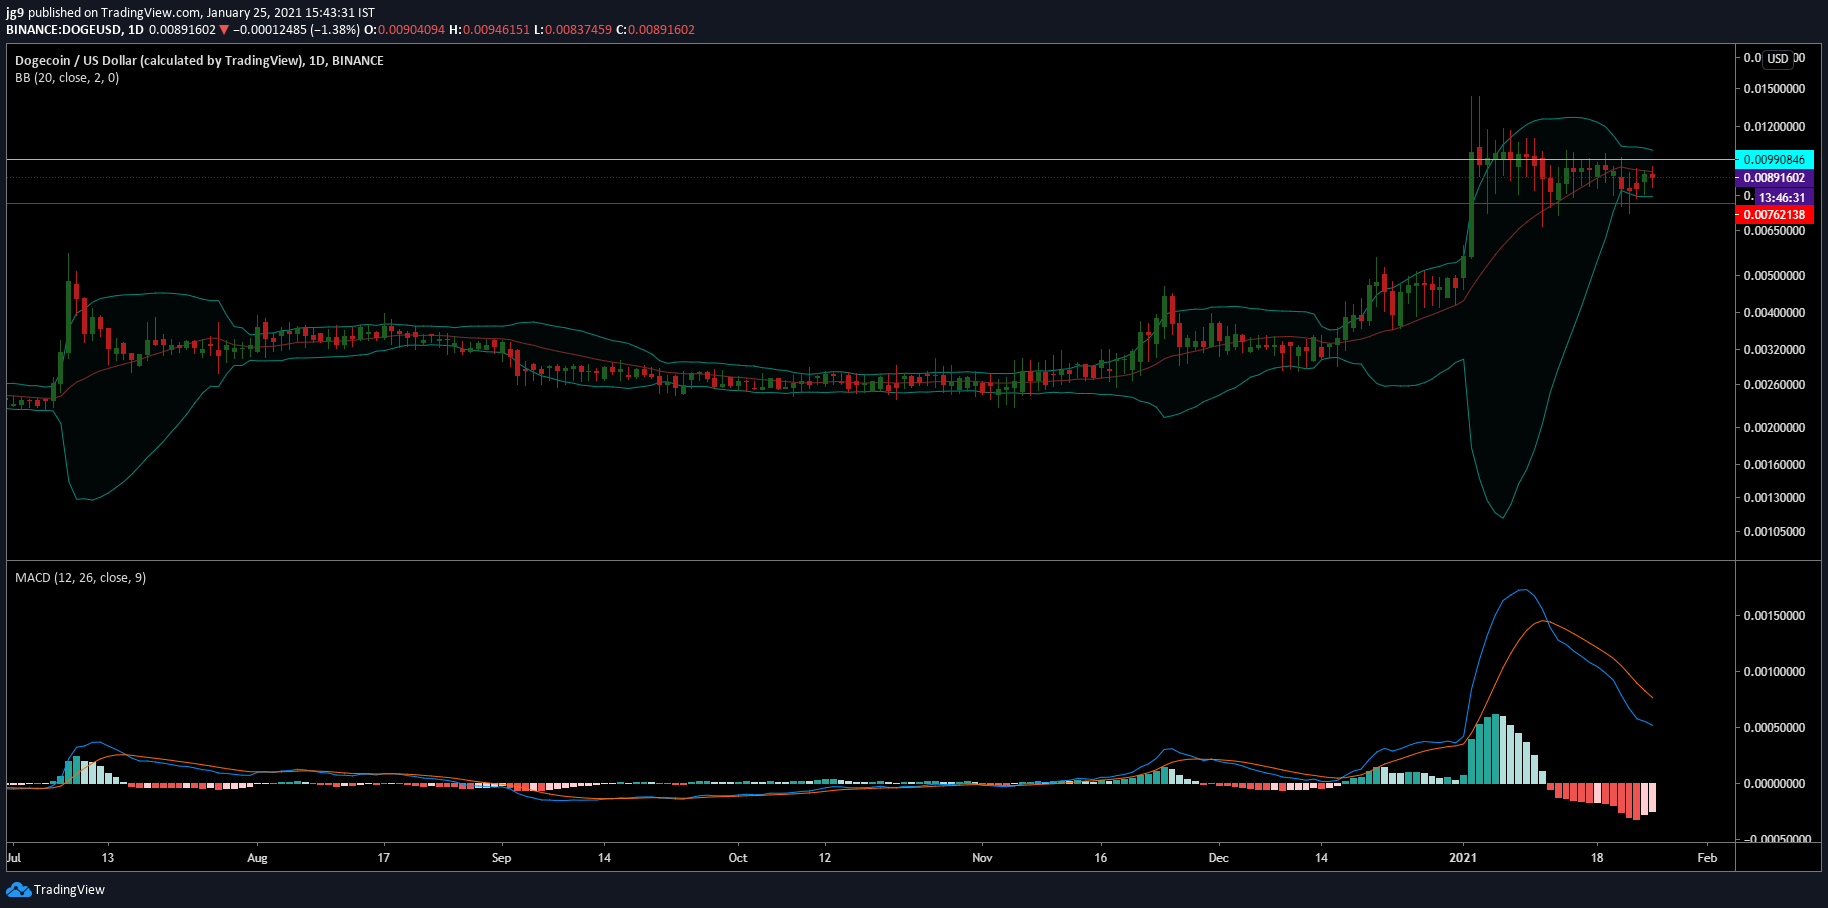
Dogecoin saw a lot of volatility in its price action at the start of the year. However, in the past week, that has changed dramatically. The coin currently trades at $0.0089 and has registered a market cap of over $1.1 billion. If the coin were to see yet another uptrend, it would first have to breach the strong resistance at $0.0099, and in case a correction was to happen the coin can rely on the support level at $0.0076.
The Bollinger Bands demonstrate the drastic dip in volatility as both bands have converged on the price. The MACD indicator has also taken the plunge after having undergone a bearish crossover a few days ago.