Litecoin, Elrond, Dash Price Analysis: 10 April

Litecoin needed stronger cues to climb above $244.2 resistance, but its long-term prediction was still bullish. Elrond could break down from an ascending channel after touching $210, while Dash’s bearish indicators could hinder its attempt to rise above $291.4-resistance.
Litecoin [LTC]

Source: LTC/USD, TradingView
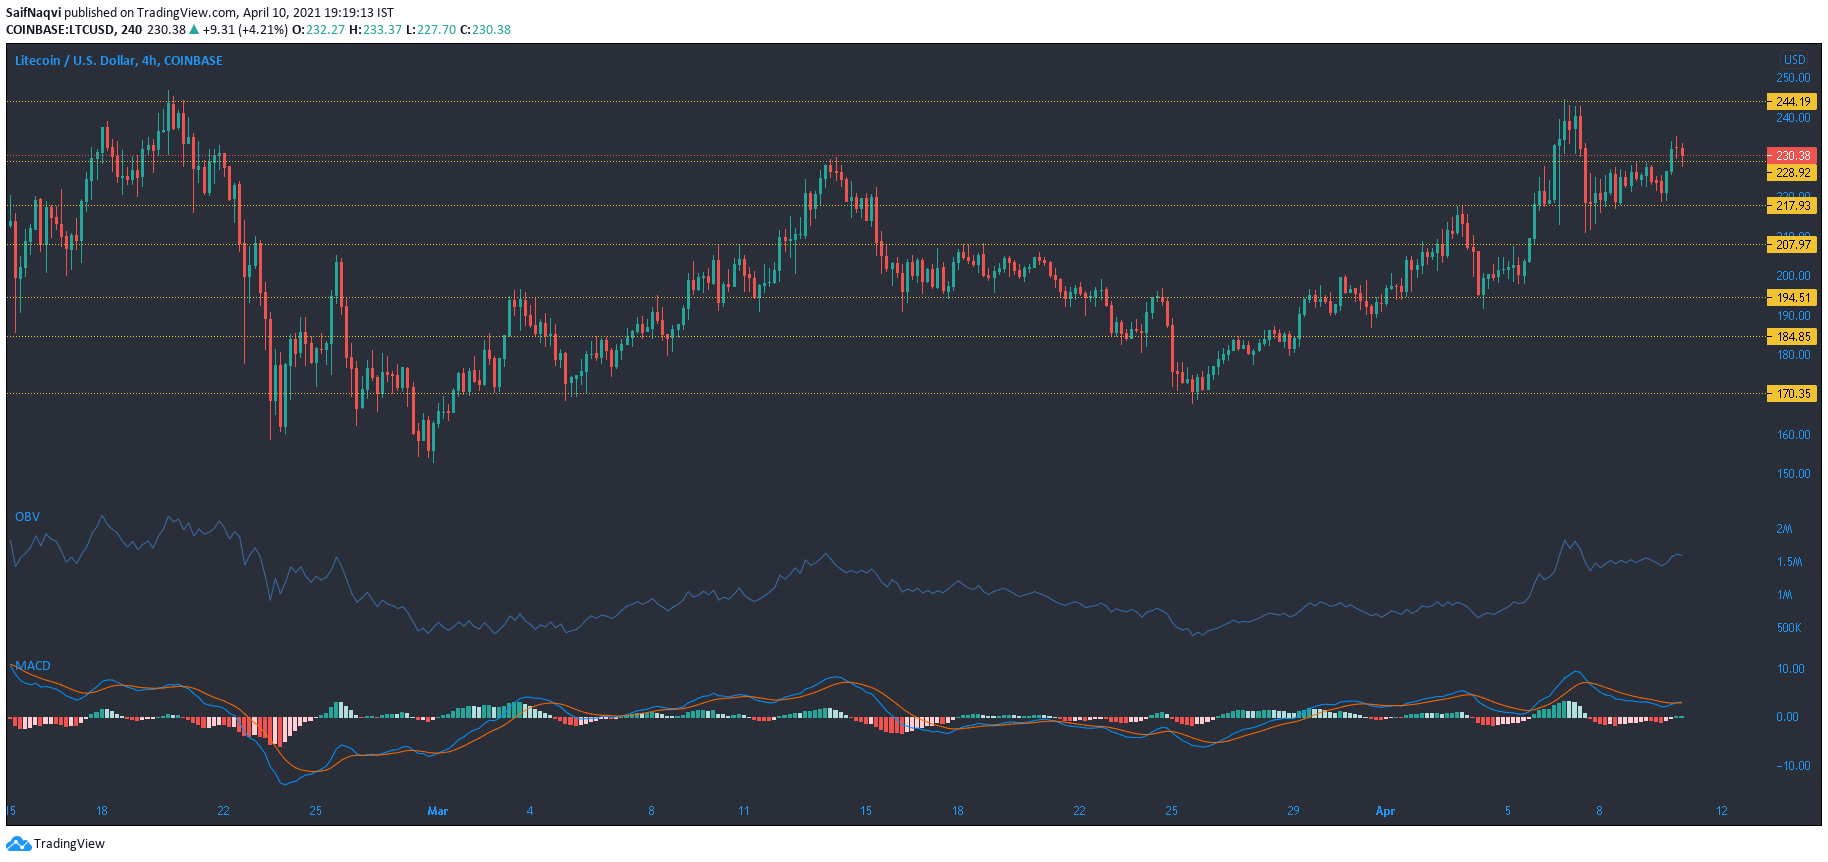
While Litecoin did flip $228.9 to a region of support, the bears looked to retest this level once again at the time of writing. A bullish crossover on the MACD suggested that the bulls could hold on to the newly flipped support line, but the indicator must be observed over the next few hours for clearer direction.
The OBV has generally trended higher since the start of 2021 and nearly completed a recovery towards late-February levels after drifting lower throughout March. LTC’s long-term trajectory was still bullish but the market may not be ready for a climb above $244.2 just yet. The price could see dips towards $217.9 or even $207.9 before breaching its overhead resistance.
Elrond [EGLD]

Source: EGLD/USD, TradingView
On the 4-hour timeframe, Elrond moved within an ascending channel after a bounce back from $170.7-support. However, there was some resistance around $210 and EGLD was expected to break down from the pattern once it approached this level.
Even though the MACD and RSI reflected a bull market, bearish divergences were spotted on both indicators. This reinforced the idea of a breakdown over the coming sessions. Such an outcome would highlight defensive lines at $195.1 and $185.2. On the flip side, a successful breakout above $210 could see a newer ATH on the charts.
Dash [DASH]

Source: DASH/USD, TradingView
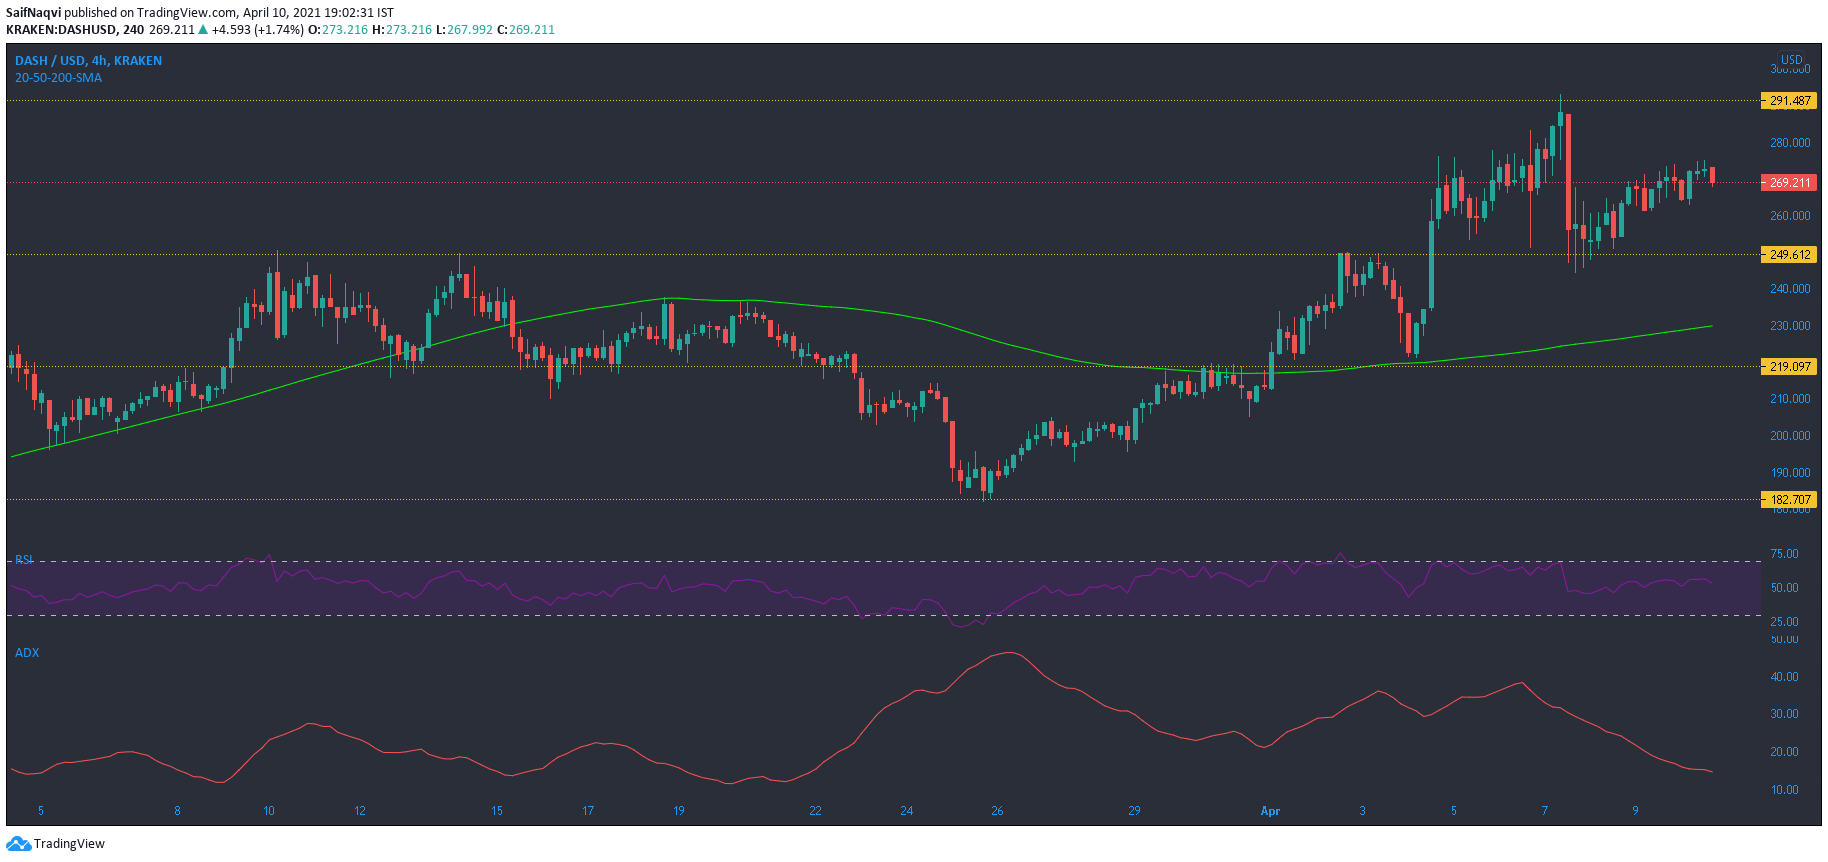
Dash’s recovery has been quite impressive over the past couple of weeks. A comeback from $182.7 support towards a peak of $293 represented a rise of 60% – an increase that took place in a matter of just 13 days. While the price did move south after failing to overturn its overhead resistance, the bulls looked to reattempt this feat once again.
However, the ADX pointed south from 15 and showed a weakening trend in the market. If the RSI dips below 40 over the coming sessions, a move towards the oversold zone can be expected. This would likely see Dash lose out to its press-time support and move closer to its 200-SMA (green). A dip below this could even lead to an extended sell-off.


