Tron, Algorand, Hedera Hashgraph Price Analysis: 10 April


Tron’s breakout from an ascending triangle was limited at the $0.12 resistance. Algorand’s bearish technicals were tipped to outweigh bullish cues from the broader market, while Hedera Hashgraph was projected to trade sideways over the coming sessions.
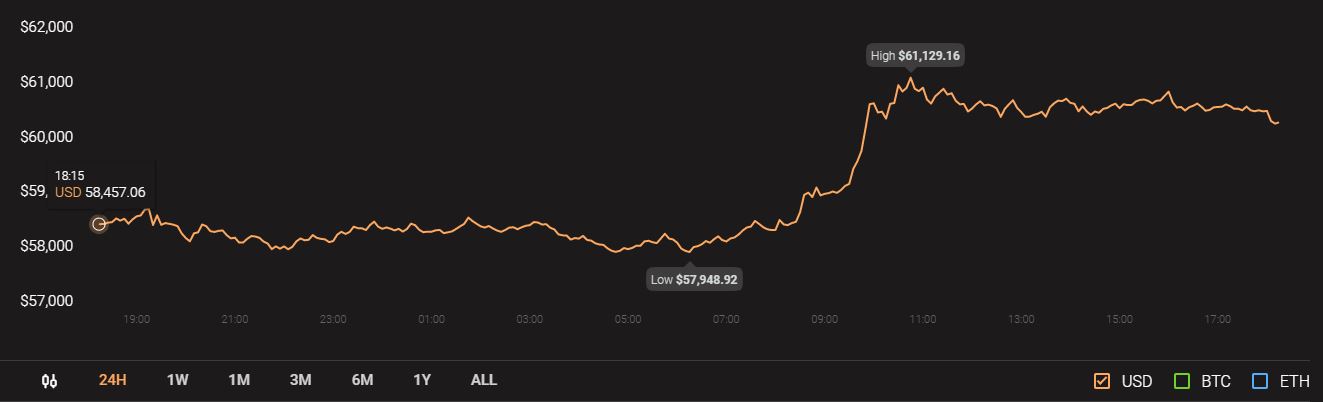
Meanwhile, Bitcoin was trading at $60,309 with a market capitalization of $1.1 trillion.
Tron [TRX]
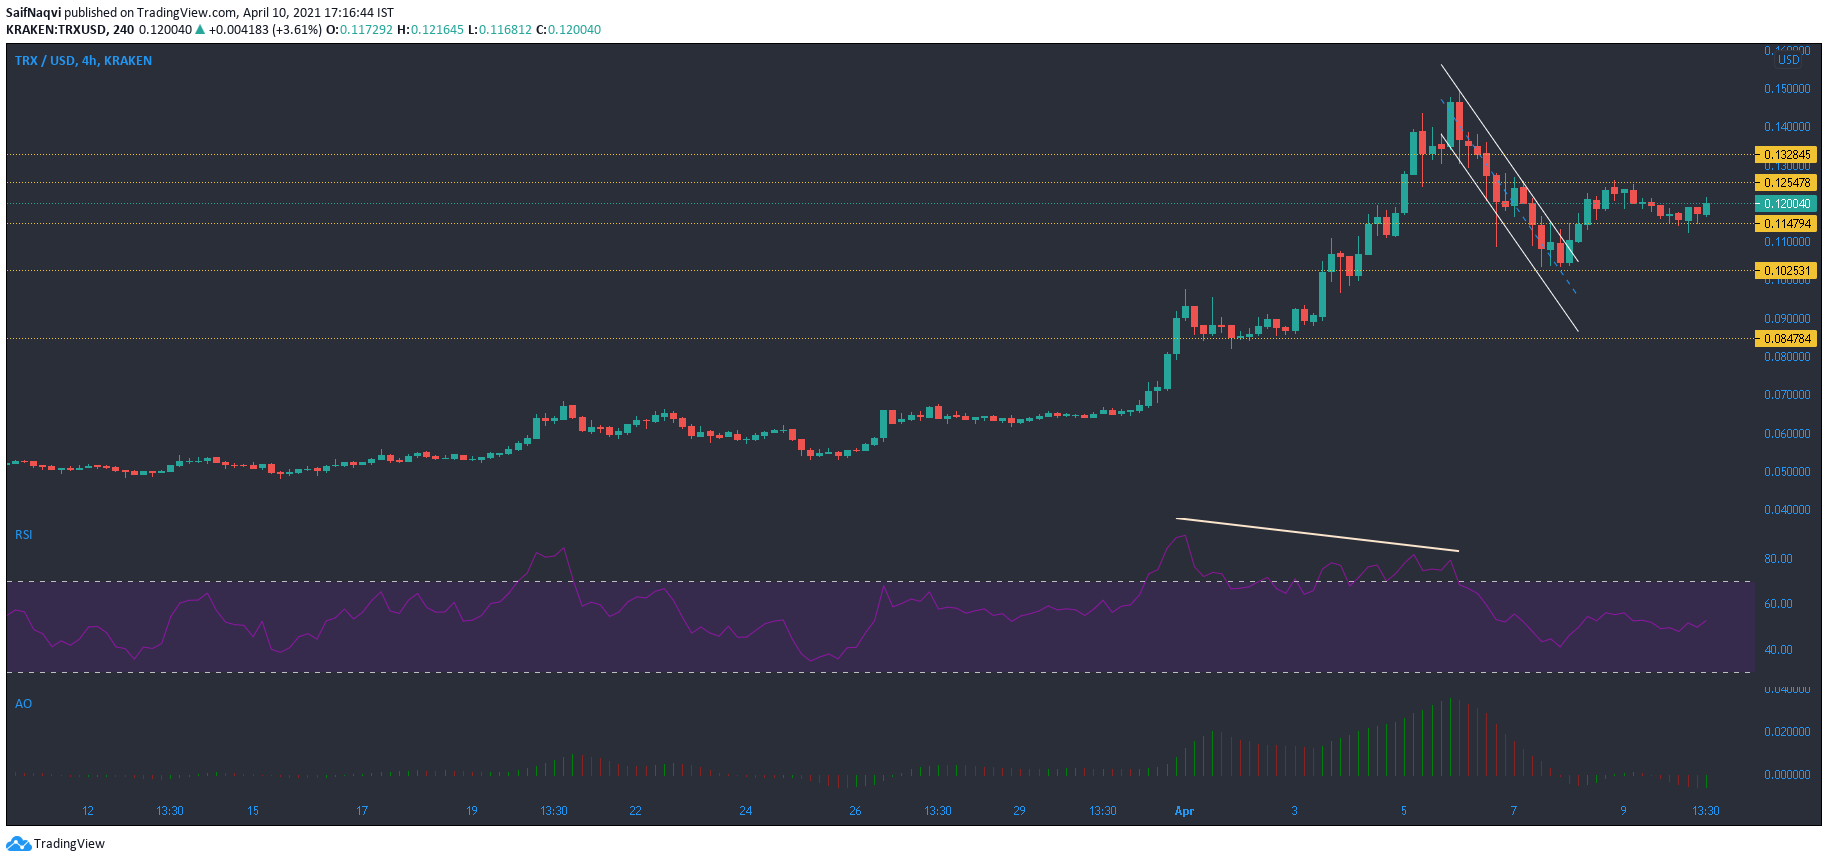
On the 4-hour timeframe, Tron saw a breakout from a descending channel, but resistance at $0.12 capped gains in the market. Since then, the price moved sideways and remained within a tight channel of $0.125-$0.114.
The RSI showed a bearish divergence as TRX reversed its trajectory after forming a local top at $0.149. At the time of writing, the RSI pointed north from 50 and indicated some bullish presence. The Awesome Oscillator registered a single green bar but more momentum needed to be gathered for an upswing. In the case of a northbound move, resistance levels reside at $0.125 and $0.132.
Algorand [ALGO]
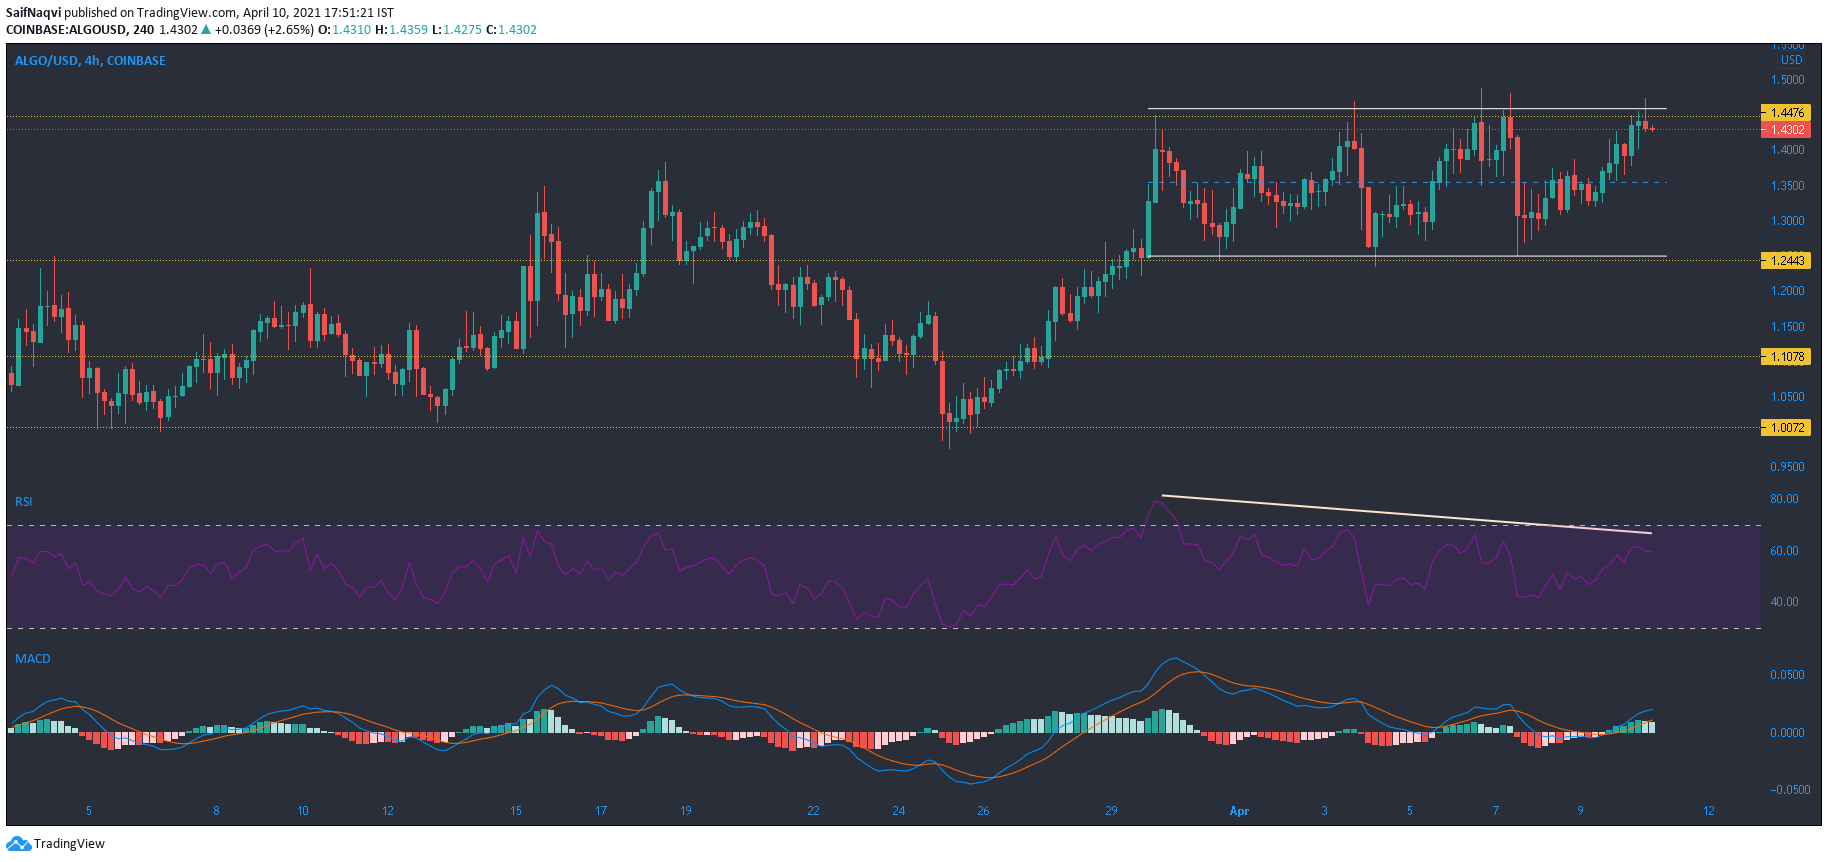
Algorand’s region between $1.44 and $1.24 represented a fierce battle for control between the buyers and sellers. During late February, this region witnessed a breakdown but that was back when Bitcoin retraced from $58,000. With the current price of Bitcoin back above $60k, a breakout could soon take place in the opposite direction for ALGO.
A move above $1.44-resistance would likely boost the price towards the next ceiling at $1.599. However, a bearish divergence on the RSI worked against a favorable outcome. Lower highs were also observed on the MACD, and its histogram noted a decrease in bullish momentum. While the broader market did signal bullish cues, ALGO’s technicals were expected to take precedence with regards to its short-term trajectory.
Hedera Hashgraph [HBAR]
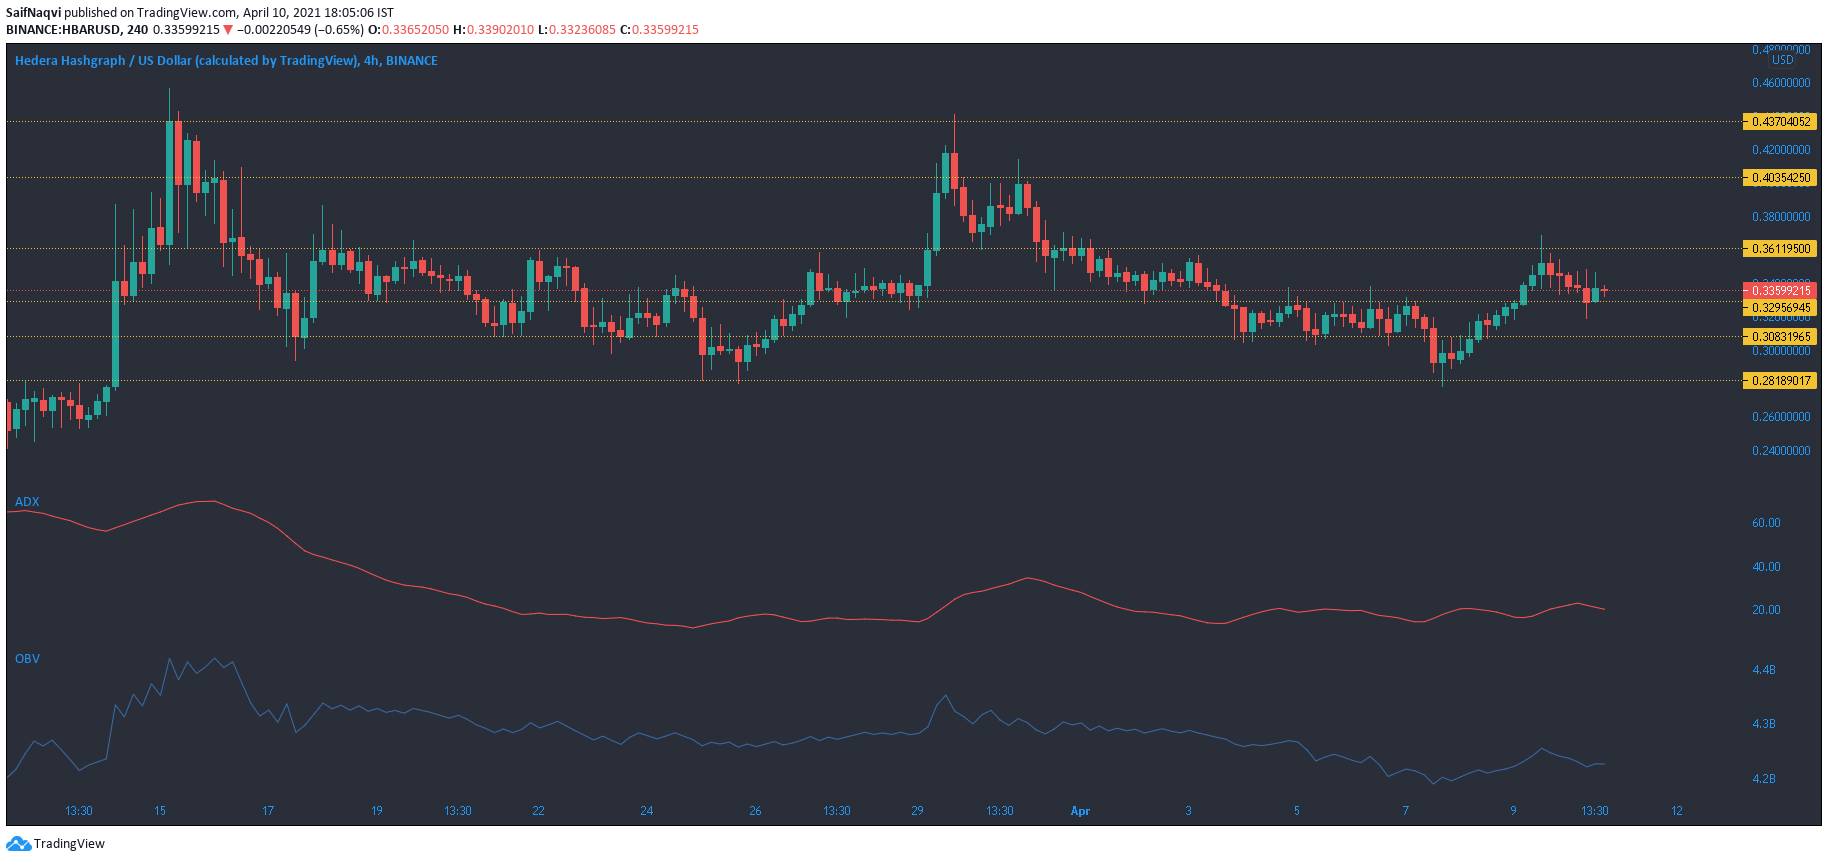
Bearish movement over the last 24 hours dragged HBAR lower on the charts but the bulls held on to $0.329 support. A dip below this level would highlight another region of surppot at $0.28 – an area that has seen buying on previous occasions.
An ADX reading of 19 certainly did not did favor the bulls. In fact, it pointed south and hinted at consolidation moving forward. The OBV’s trajectory also did not warrant an immediate breakout. When the price does move north, resistance can be expected at $0.403 and $0.437.