
Litecoin was trading within a triangle pattern, preparing for a breakout that will likely see LTC zoom toward $250. This move upward was not yet in play. EOS was dipping toward the $5.85 level, losing which it would be forced to visit $5.35. Decred showed a bearish divergence.
Litecoin [LTC]
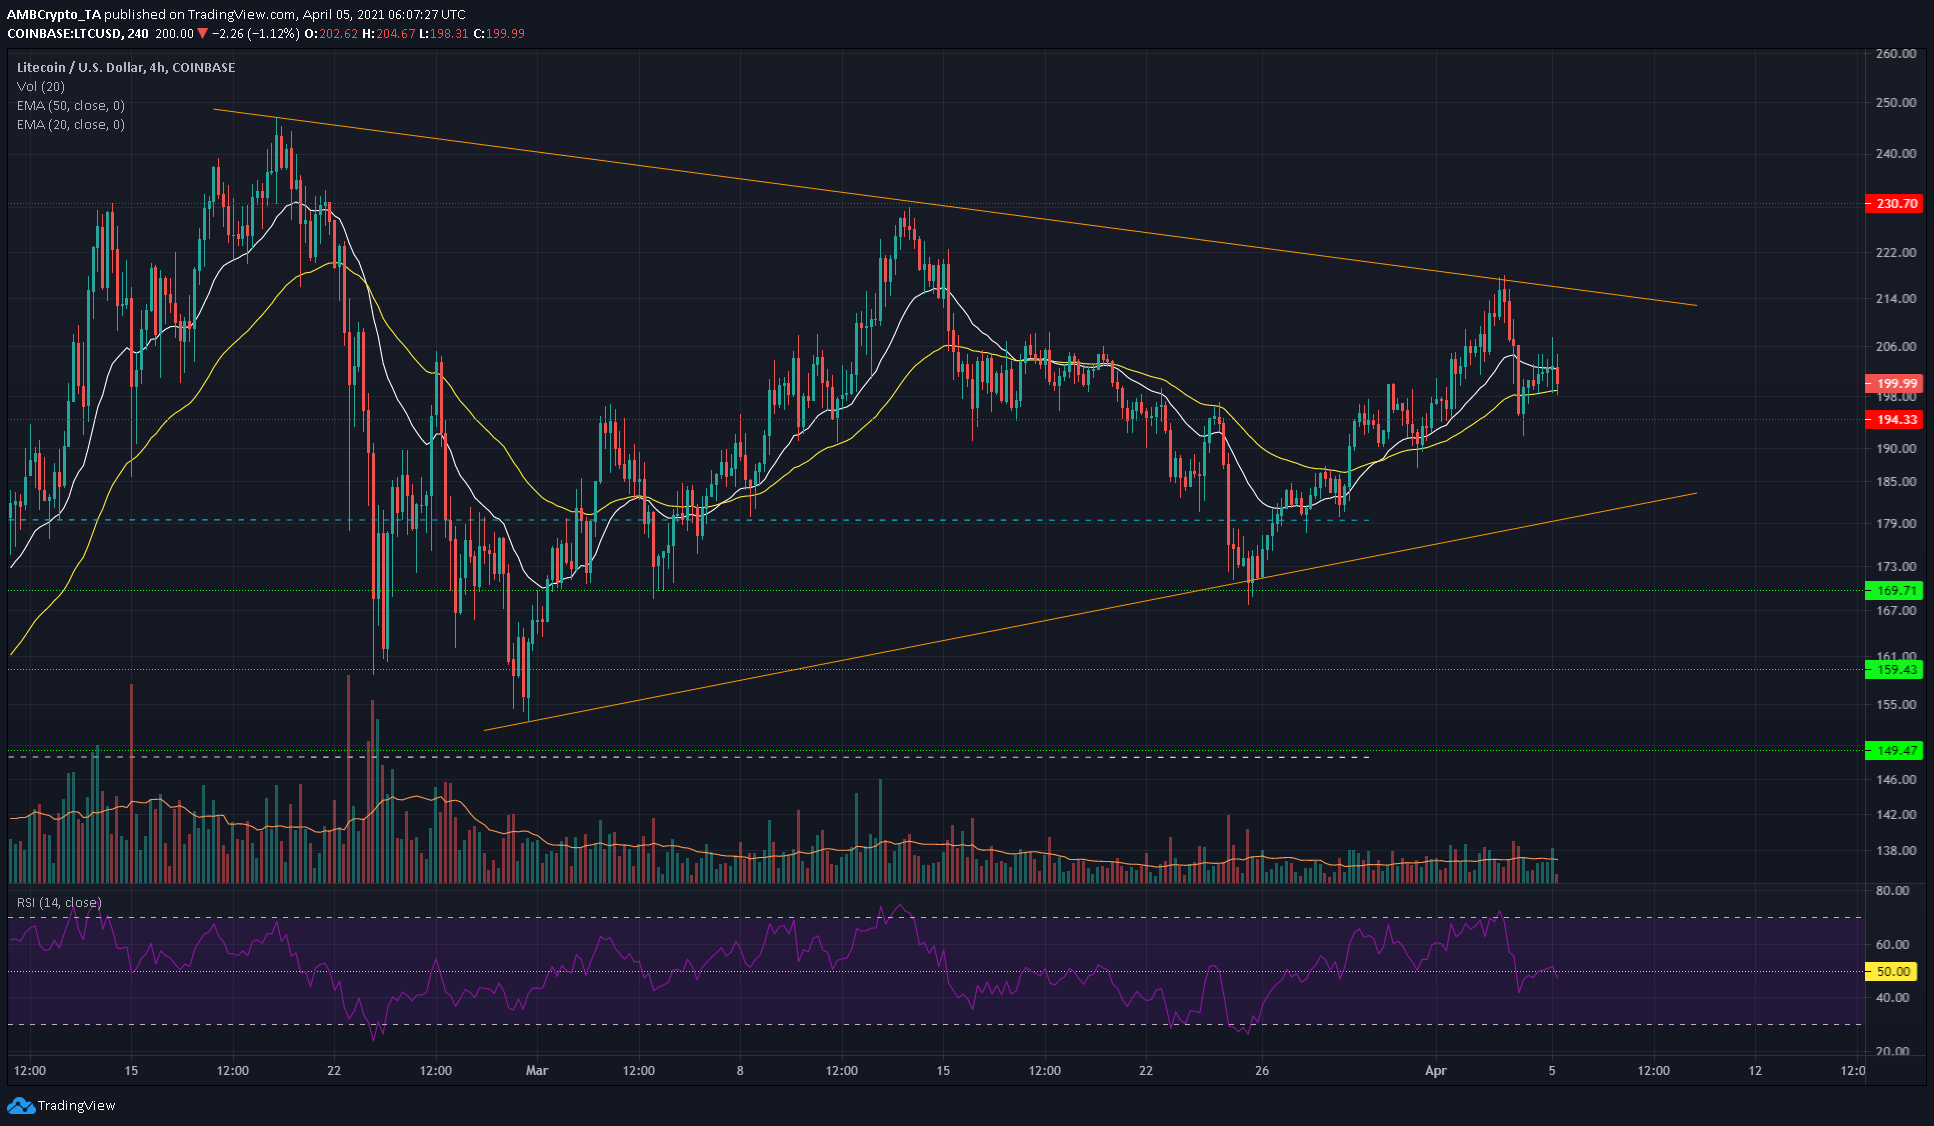
Source: LTC/USD on TradingView
Litecoin formed a symmetrical triangle pattern and was gathering steam above the $194 level of support. The 20 EMA (white) was moving above the 50-period EMA (yellow) which offered some support to the price.
A breakout or a breakdown will be signaled upon a trading session close outside the pattern on heavy trading volume, indicating the market had reached a decision.
At the time of writing, bears might have the upper hand because the RSI dropped below neutral 50 and retested it as resistance.
EOS
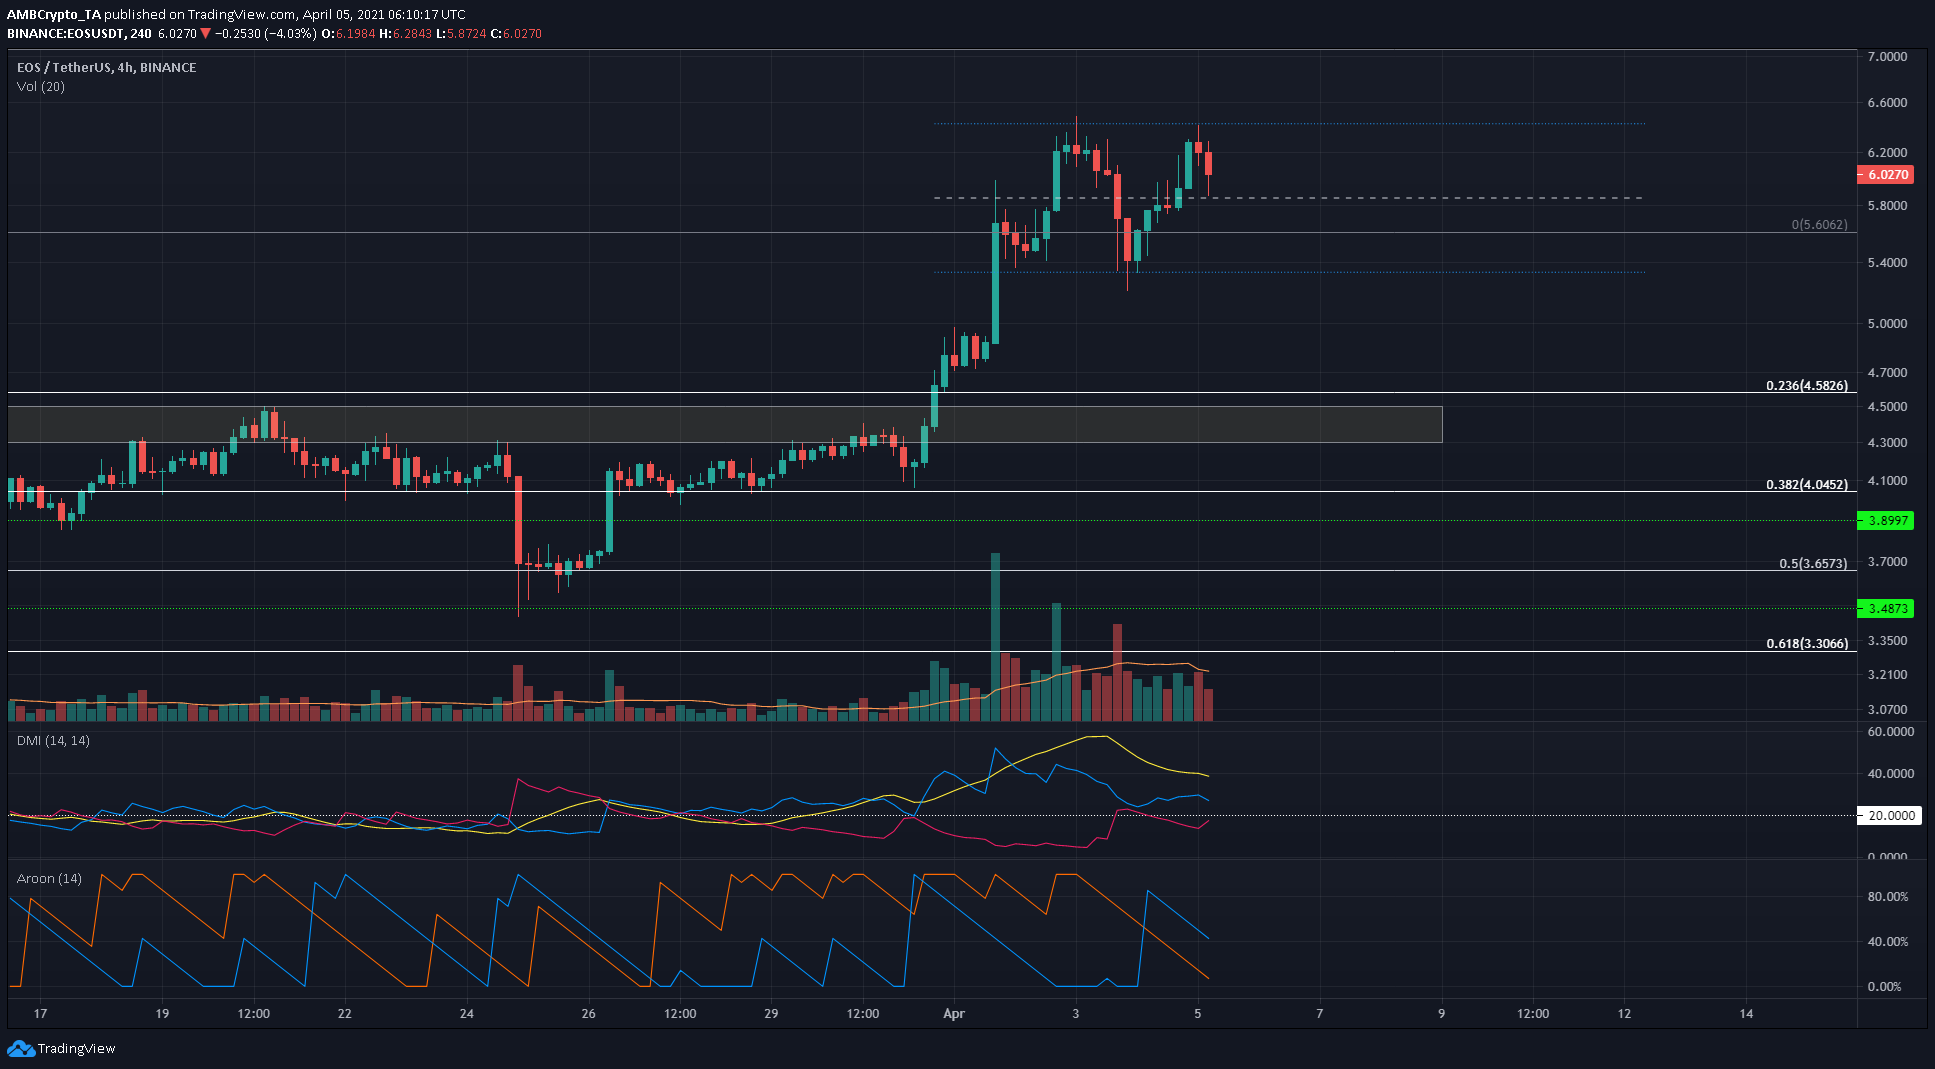
Source: EOS/USDT on TradingView
EOS surged past the highlighted area of supply at $4.3 and was trading at $6.02 at the time of writing. However, the past few days have seen EOS bounce between the $5.35 and $6.4 levels, forming what could be a short-term range. The mid-point at $5.85 does seem to offer some resistance and support, although this was not yet an important range.
The Directional Movement Index showed a falling ADX (yellow) to signal that the previous uptrend was losing strength. On the Aroon indicator, Aroon Down (blue) crossed over above Aroon Up (orange).
Taken together, dropping below the $5.85 mark could see EOS revisit $5.35 in the coming days.
Decred [DCR]
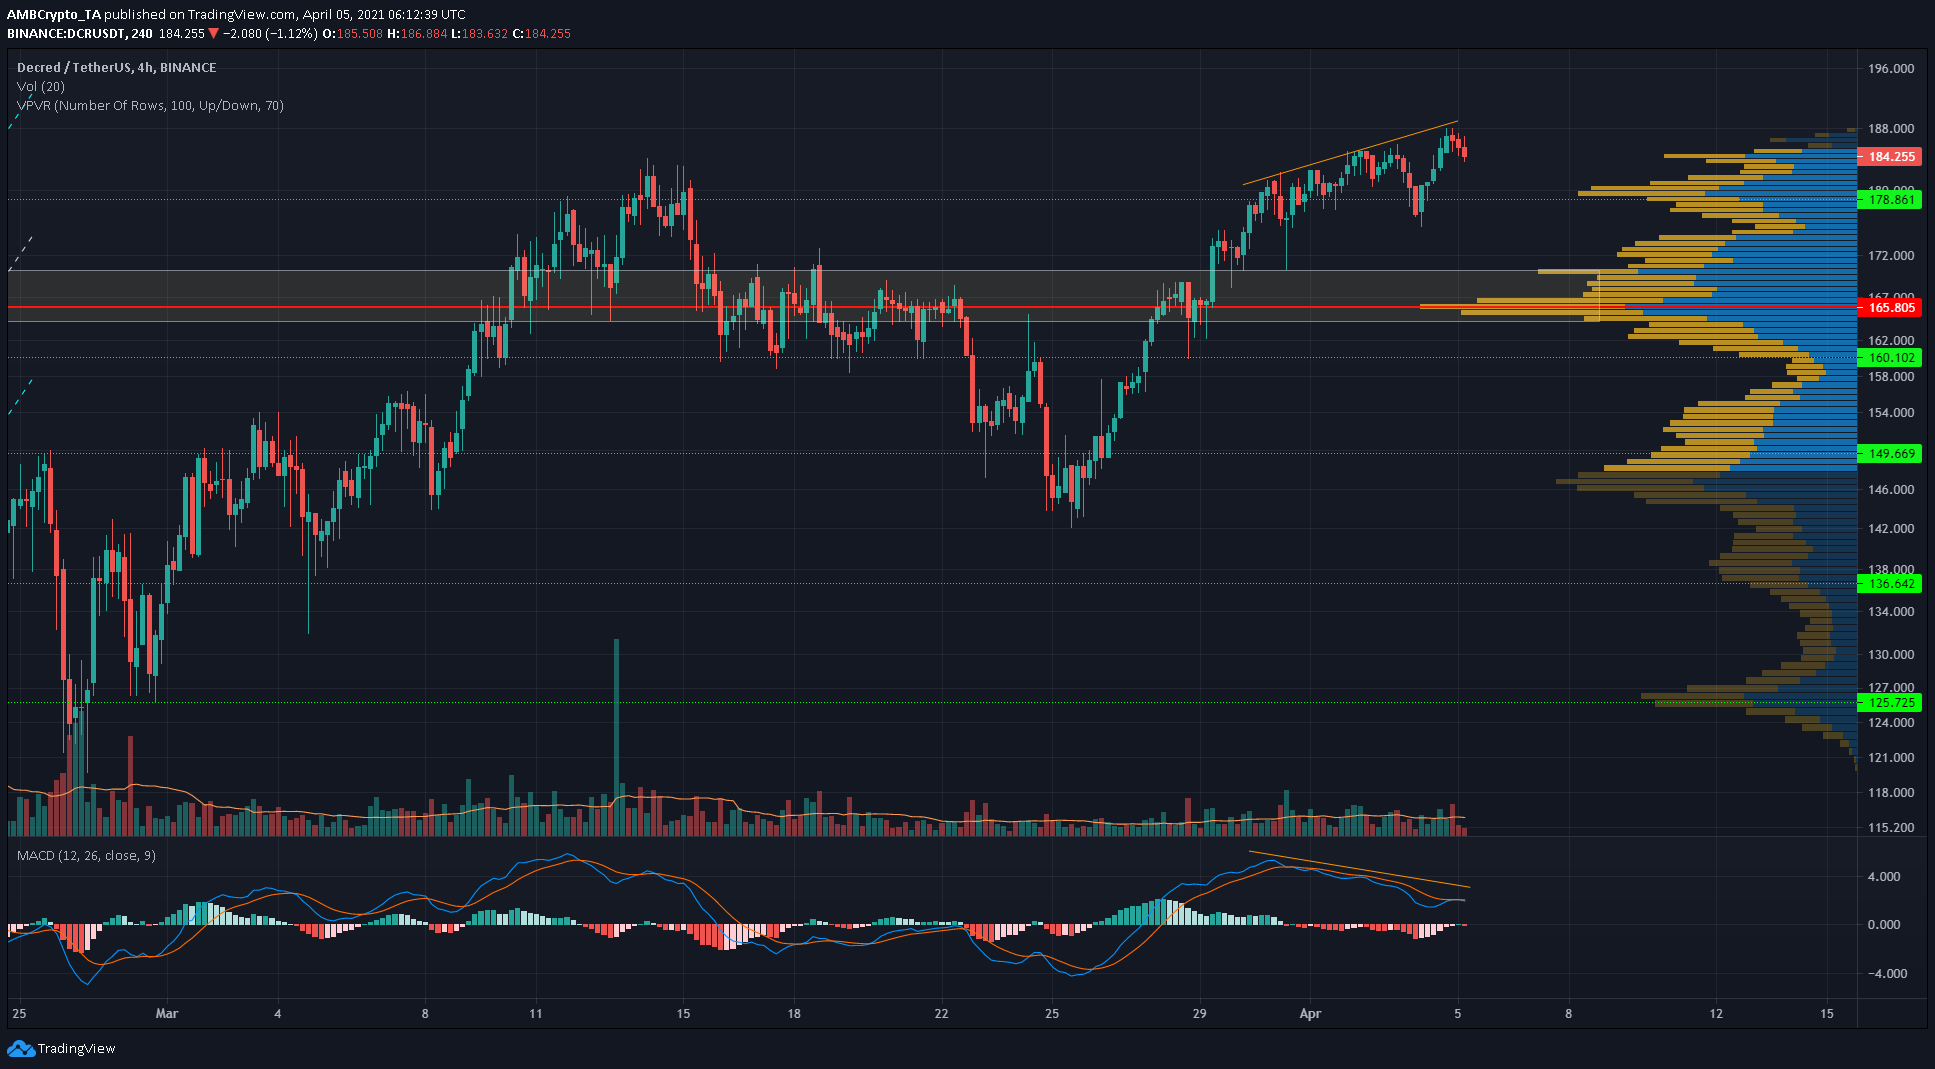
Source: DCR/USDT on TradingView
The MACD moved lower even as the prices formed higher highs in recent days, a bearish divergence that could take DCR back to the level of support at $178.
The Volume Profile Visible Range shows the trading activity by volume at different price levels for the time period visible on the chart. High amounts of trading activity suggest that the area is one of importance, with the most important, the Point of Control (PoC) at $165.8.