Litecoin forms a trend reversal pattern, here’s where you can take profit
Litecoin [LTC] formed an inverse head and shoulders pattern - a trend reversal formation that may set the asset for a 30% potential rally or reversal. Which way for LTC?
Disclaimer: The information presented does not constitute financial, investment, trading, or other types of advice and is solely the writer’s opinion
- LTC formed an inverse head and shoulders pattern.
- Addresses with more than $10k increased.
After a strong rally in January, Litecoin’s [LTC] price action made consistent lows and highs, chalking an inverse head and shoulders pattern.
Notably, the stiff resistance and neckline of $102.58 have rejected the price a few times. However, a break above the neckline could tip bulls for more gains.
Read Litecoin [LTC] Price Prediction 2023-24
Meanwhile, U.S. investors are currently glued on earnings season as they track Q1 earnings and results. Notably, the U.S. Flash Services PMI (Purchasing Managers Index) data will also be released on 20 April 2023.
Collectively, the earning season and the PMI data can affect U.S. stock markets, USD pairs and could spill to USDT pairs, too, LTC/USDT included. Ergo, macro traders could track this front before making moves.
A rally or likely price dump – Which way for LTC?
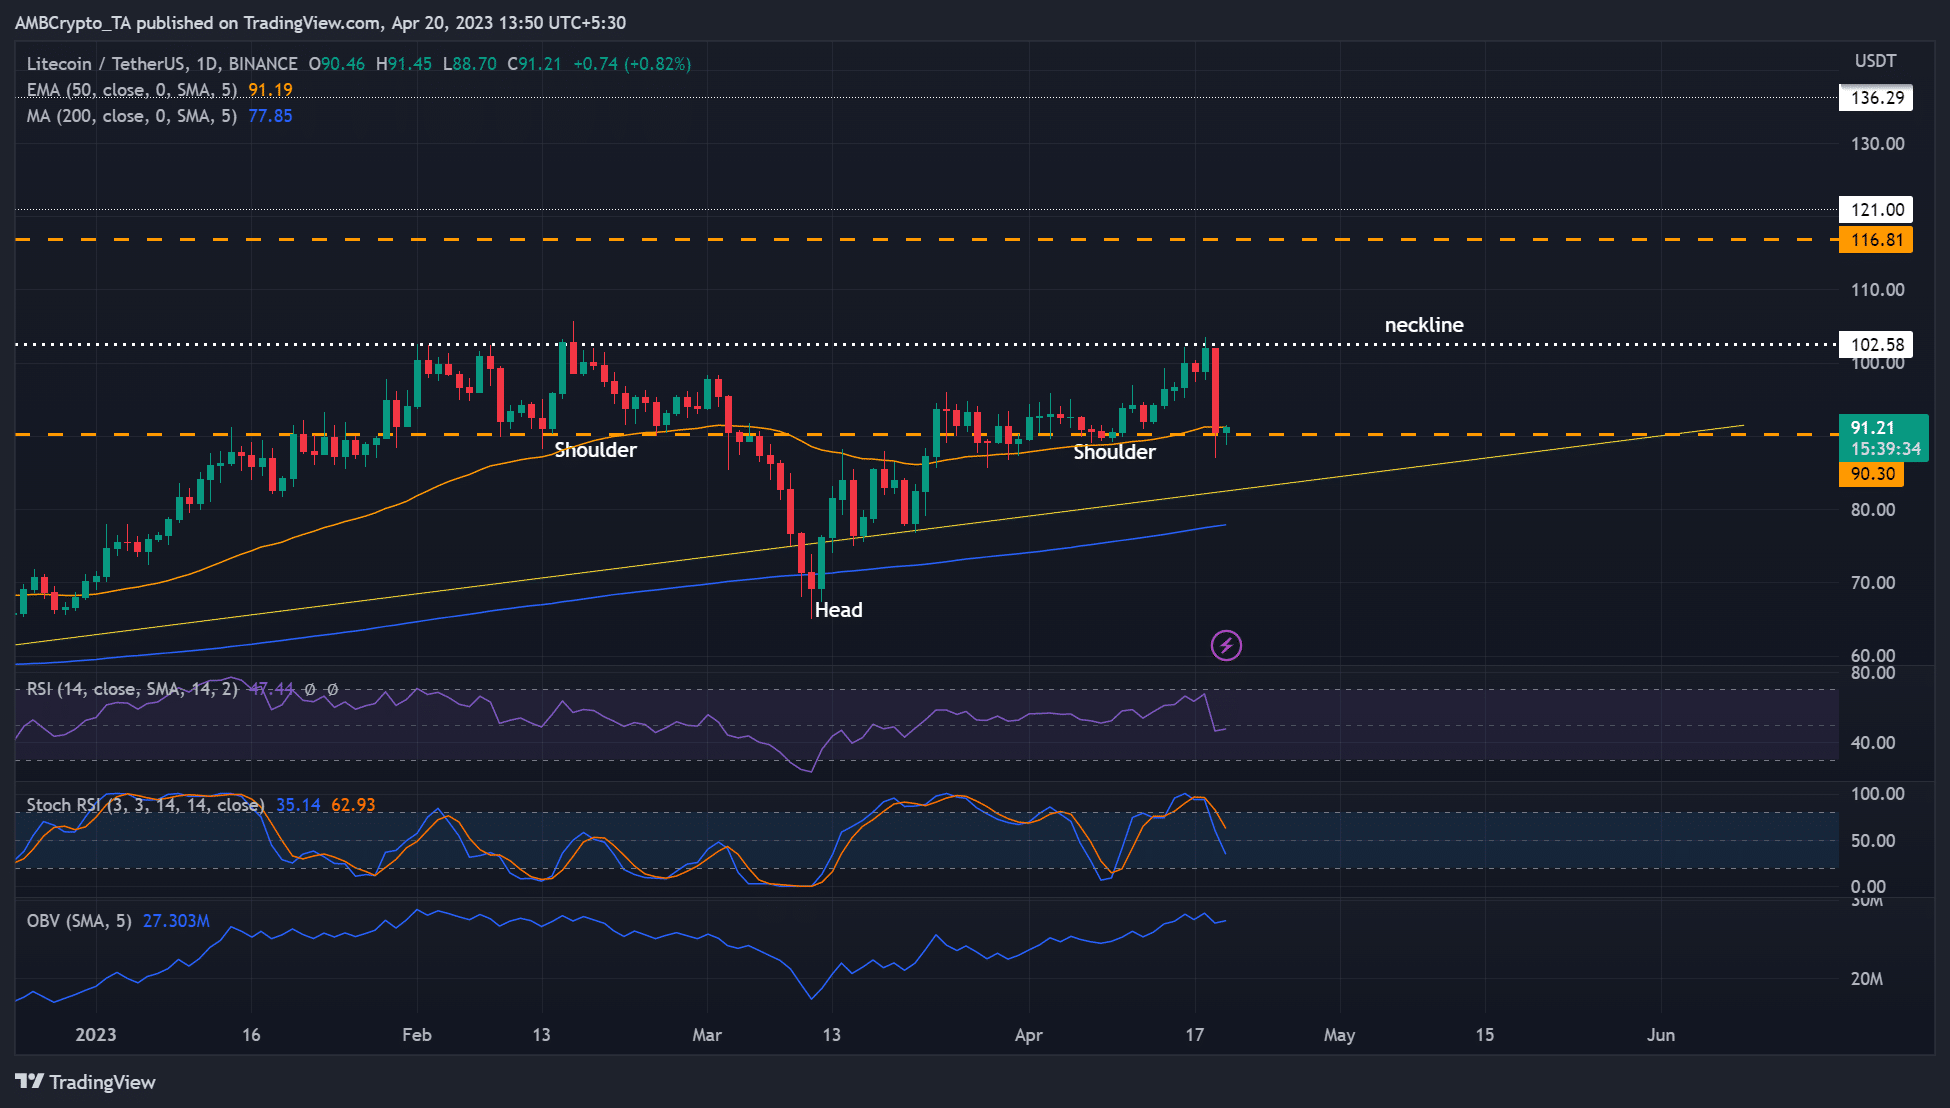
LTC’s price action chalked an inverse head and shoulders pattern, which may set LTC to rally based on the height from the head to the neckline. Also, a reversal may occur based on the same height.
On the daily chart, the RSI and stochastic RSI retreated – evidence of increased selling pressure. But sellers may cool off if stochastic RSI hits the oversold zone. On the other hand, the OBV (On Balance Volume) has increased since mid-March, indicating genuine demand for LTC.
If the trend persists, LTC could attempt to break above the neckline of $102.58, especially if Bitcoin [BTC] reclaims $29k and $30k price ranges.
As such, LTC could be tipped to hit $136.3 – a 30% potential hike. Other resistance levels lay at $116.8 and $121.
Alternatively, bears could push LTC in the opposite direction. Based on the pattern’s height, LTC could drop to $35, a swing low in March 2020. But sellers must clear hurdles at the ascending trendline, $70, $40, and Q4 2022 swing low of $50.
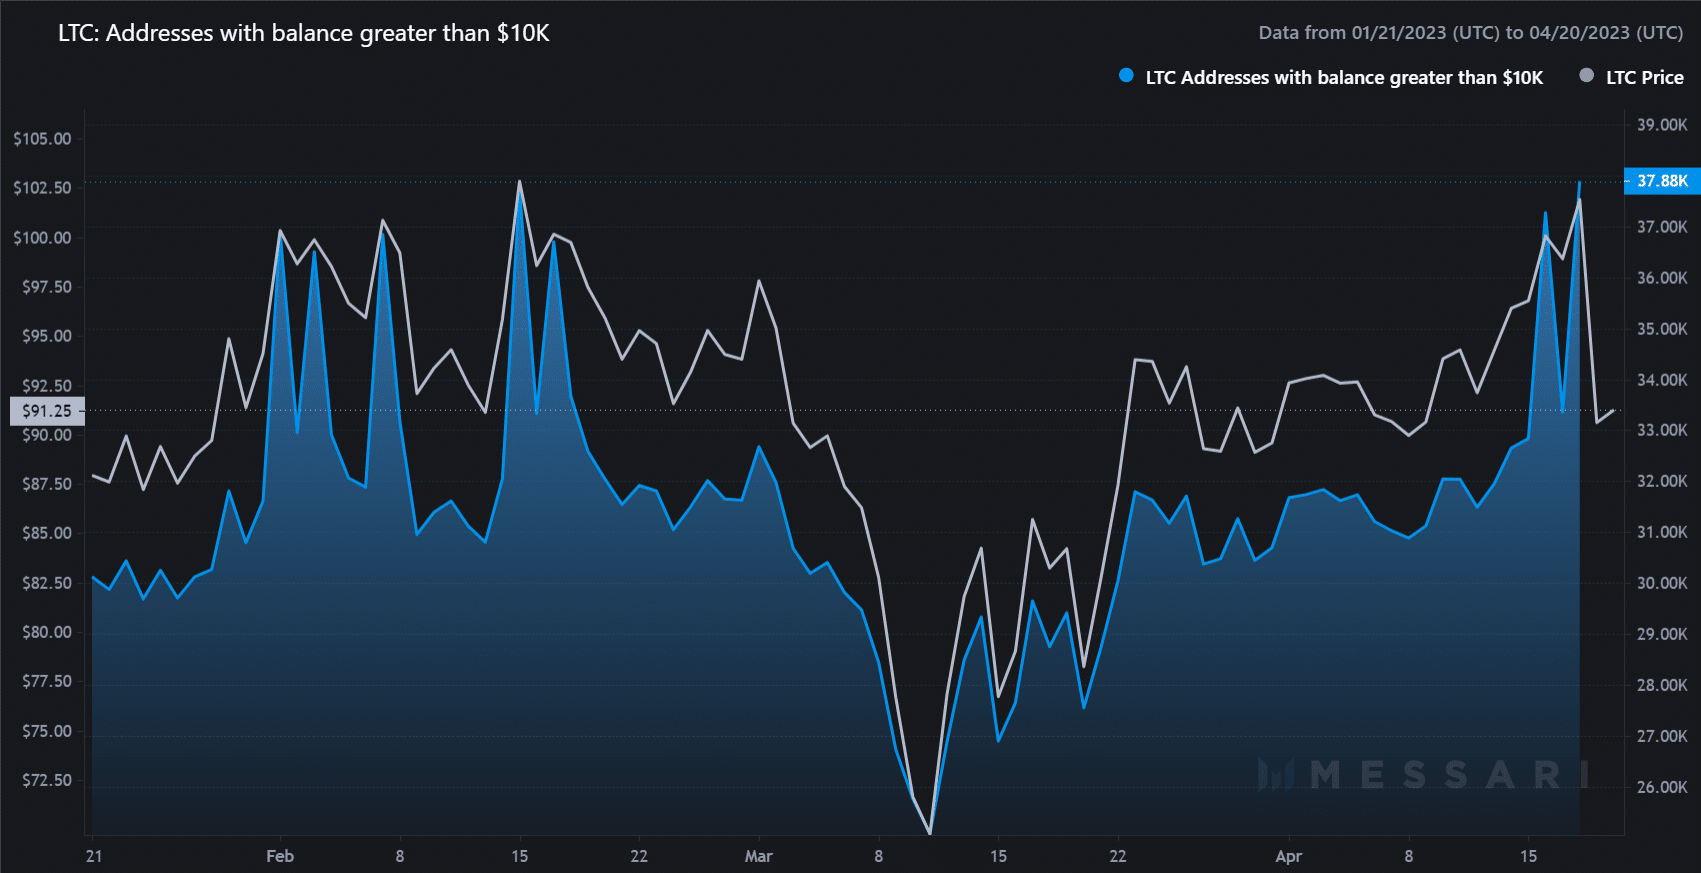
Addresses holding more than $10k increased
Is your portfolio green? Check LTC Profit Calculator
According to Messari, addresses holding more than $10k worth of LTC rose from below 26k in mid-March to 37.9k at press time. The increment captures the underlying bullish sentiment, which set LTC to break above the neckline.
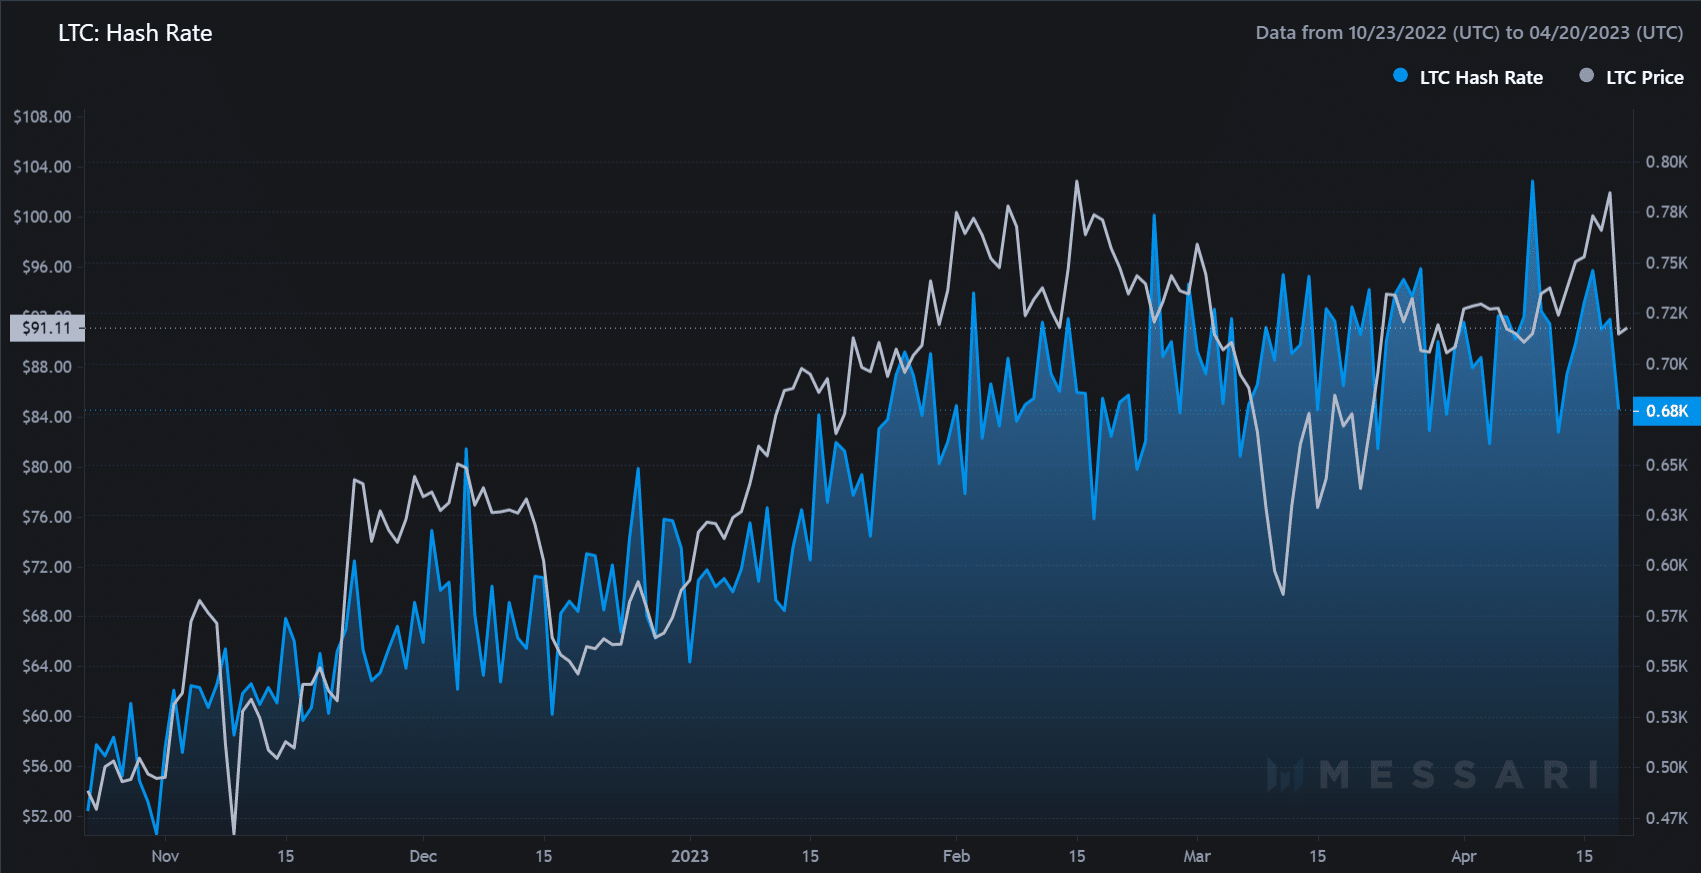
Moreover, LTC’s hash rate has increased since Q1 2023, rising from about 0.55 kH/s in early January to over 0.70 kH/s by the end of March.
The rising hashrate shows LTC became more secure and could improve investors’ confidence in the asset and prop up its long-term prospects. But investors should also track BTC’s price action before making moves.


![Rising bond yields put Bitcoin [BTC] at risk — a Fed rate hike could be next](https://ambcrypto.com/wp-content/uploads/2026/08/IMG_4752-e1785656382502.webp)