Litecoin, FTX Token, Algorand Price Analysis: 07 February

Litecoin’s price recovered after a minor correction but a break above $158 was doubtful as trading volumes were on the lower side. FTT moved southbound from its all-time high but flashed bullish signals that could see the price rise to record levels once again. ALGO moved above $0.84 resistance but some additional bullish impetus would be needed for a rise towards the $1 level.
Litecoin [LTC]
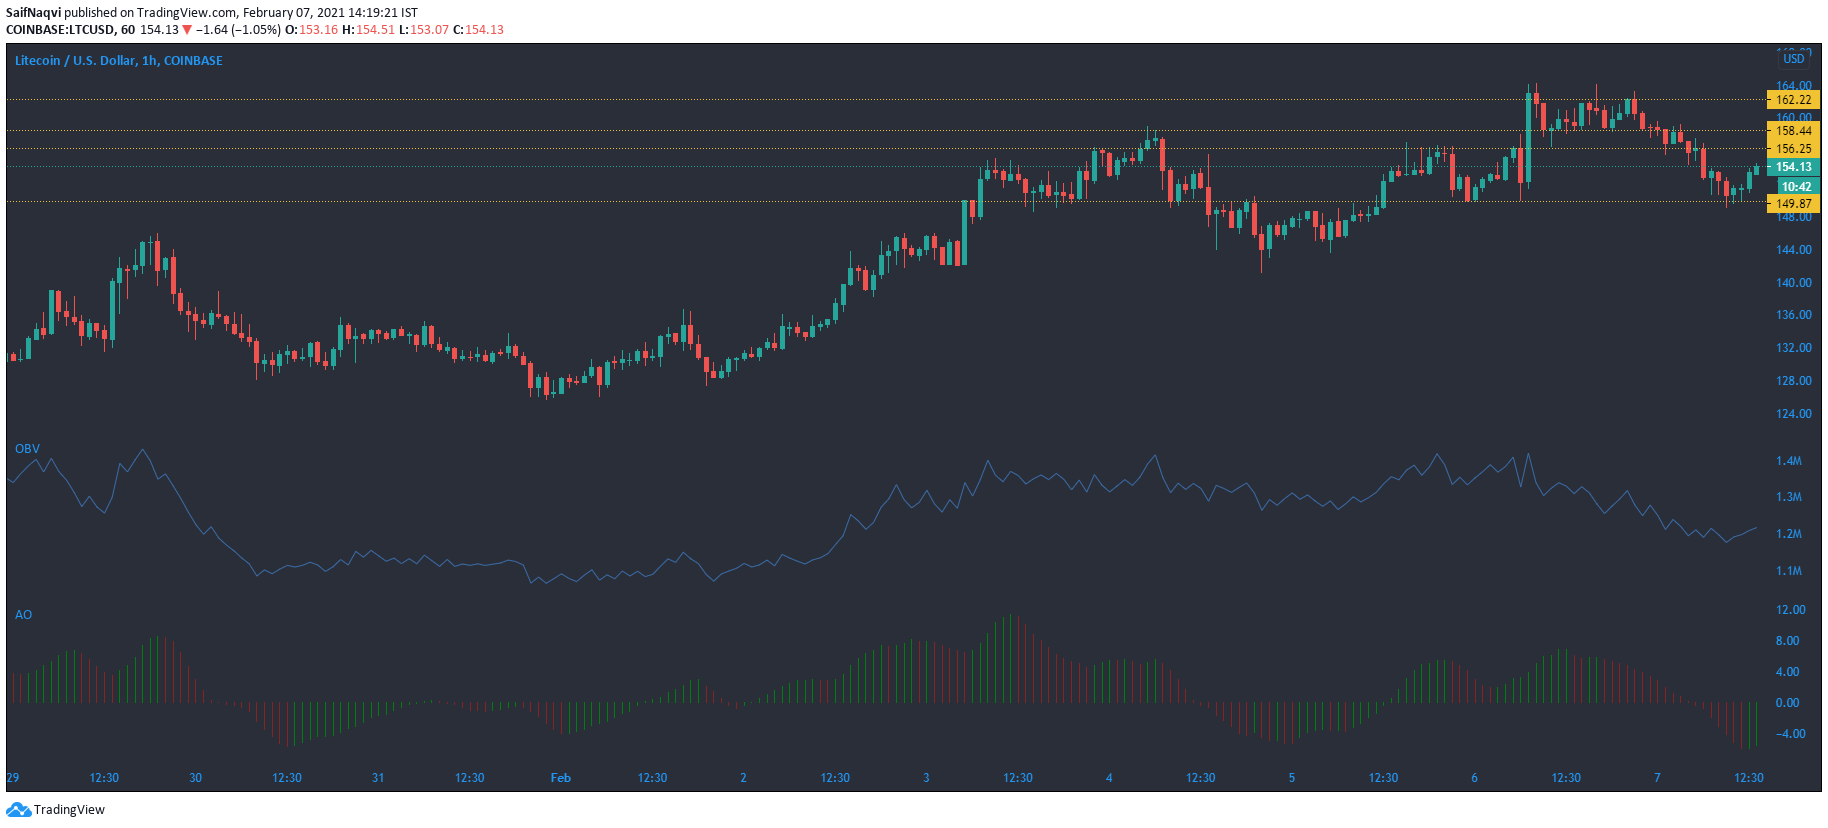
Litecoin’s price picked up from the $150 support after a correction saw gains shrink by over 6% from its local high of $163. The selling pressure was evident on the On Balance Volume, which consistently formed lower lows on the charts. However, an uptick was registered in the last session of trade.
The Awesome Oscillator noted some bullish movement as the bars switched to green. Despite the short term bullish prediction, a rise above the $158 level was an unlikely scenario unless the trading volumes rose sharply over the next 24 hours.
FTX Token [FTT]
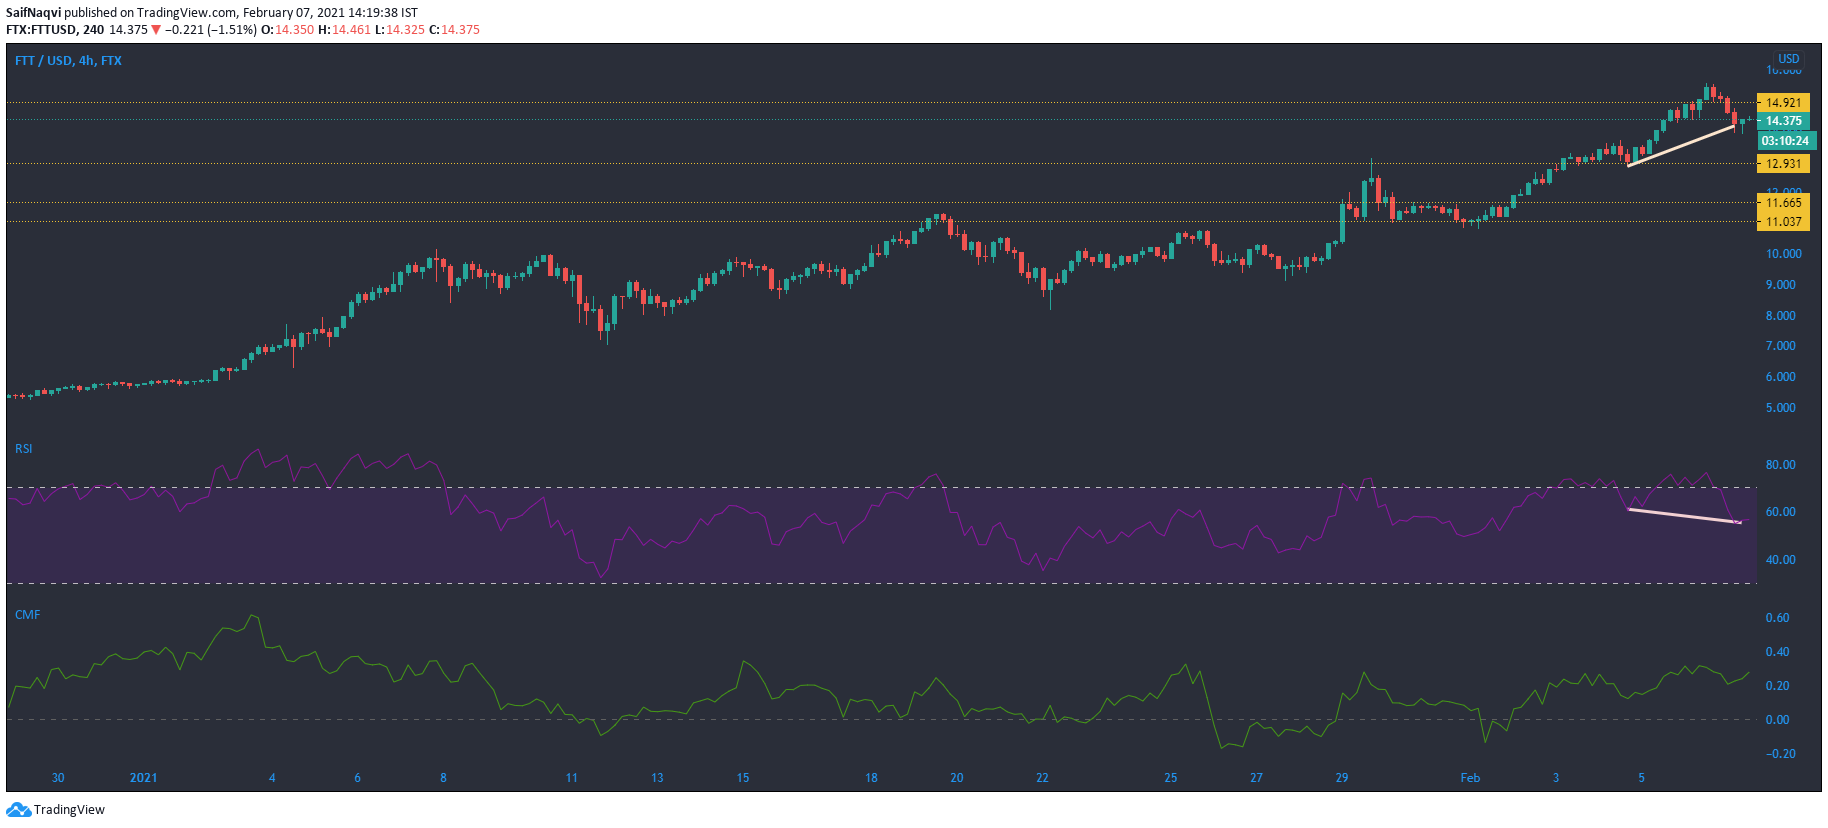
FTX Token snapped yet another all-time high on the charts as the price moved north of $15. A minor pullback saw FTT shed nearly 3% in the past 24 hours but this was expected to be a temporary move considering its uptrend over the past 30 days.
Further bullish cues were given by a bullish divergence on the Relative Strength Index and the Chaikin Money Flow, which showed strong capital inflows since the crypto asset flipped $11.6 resistance at the start of the month. Moving forward, FTT could see newer highs on the charts, barring a pullback in the broader market.
Algorand [ALGO]
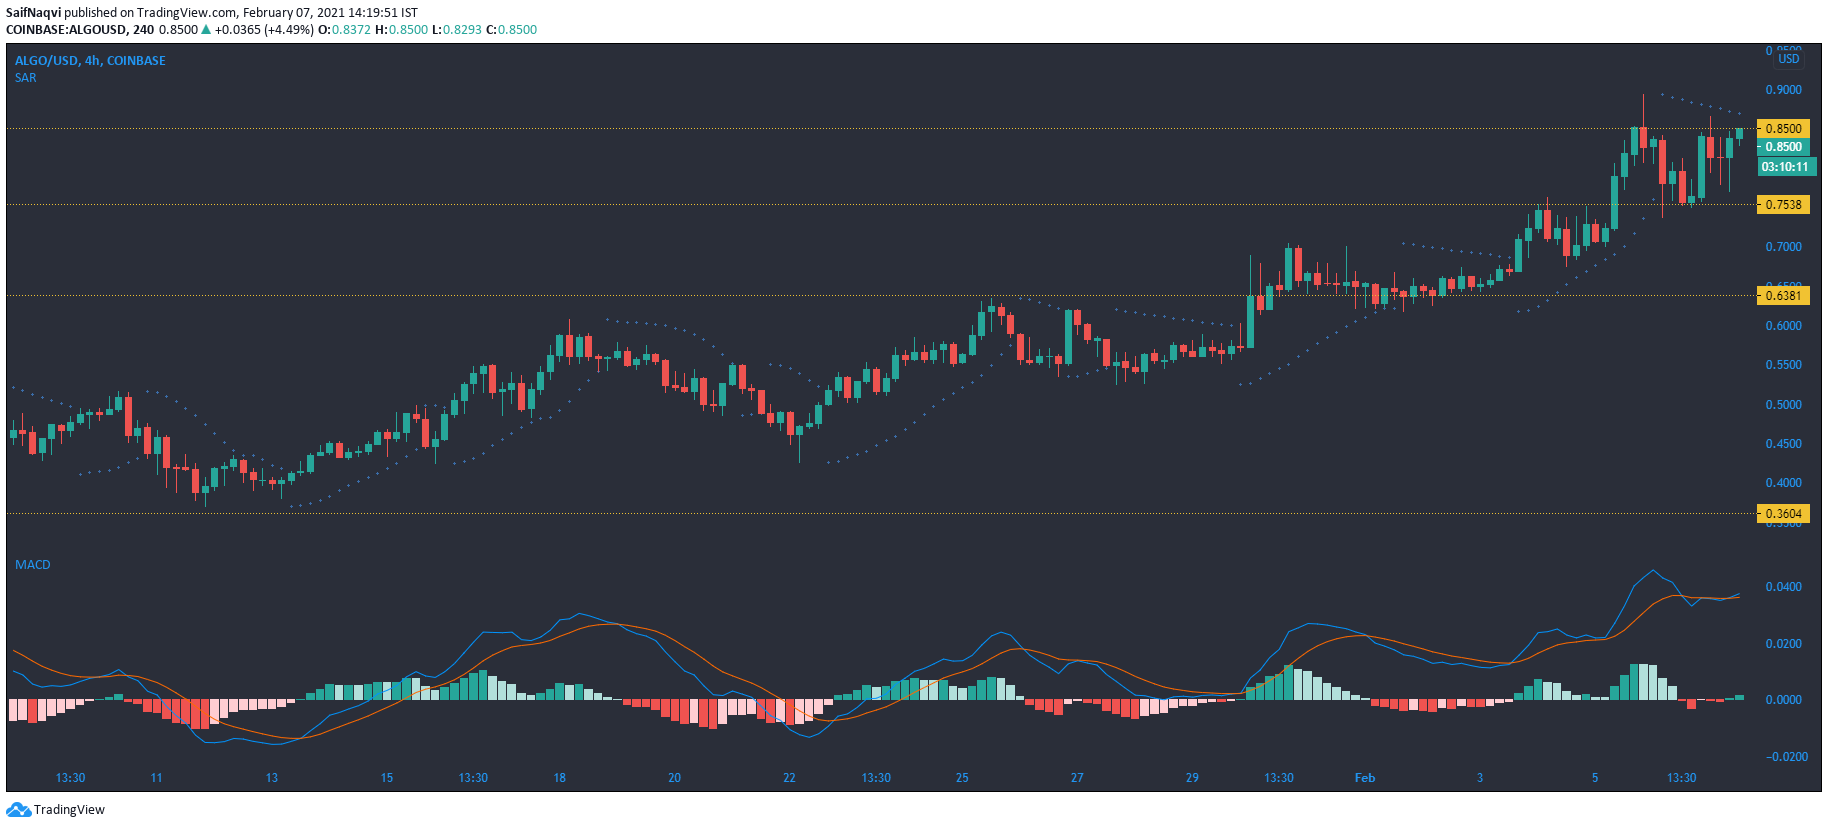
The daily timeframe on Algorand showed an uptrend since the start of the year as the cryptocurrency snapped higher highs on the charts. On a lower timeframe, some fluctuation was seen in ALGO’s price but it finally broke above $0.85 resistance. Since the trading volumes were subdued over the past 24 hours, a rise towards the $1 mark was a tall order moving forward.
The Parabolic SAR’s dotted markers moved above the candlesticks, signaling the short term downtrend over the past few sessions. A bearish outcome could see ALGO slip below $0.75 support. On the other hand, the MACD slightly favored the bulls as the MACD line gained an edge over the signal-line. A bullish outcome could see ALGO snap a fresher local high on the charts.